MSTR Elliott Wave Analysis: Market Insights and Future Projections
This article delves into the Elliott Wave Theory to analyze MicroStrategy Inc. (MSTR), providing insights based on daily and 4-hour chart evaluations. The goal is to present a detailed understanding of MSTR's current market trend and potential future price movements.
TradingLounge Stock MSTR Elliott Wave Analysis - Daily Chart
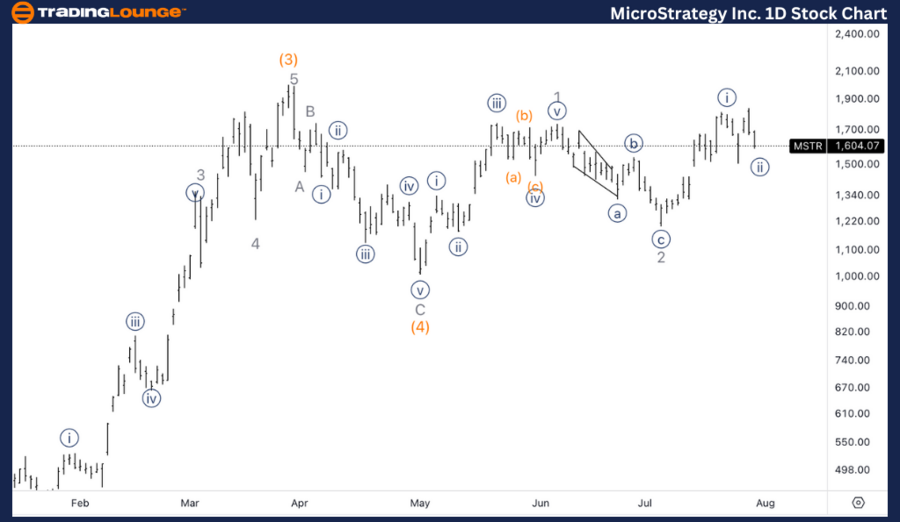
MicroStrategy Inc. (MSTR) Daily Chart Analysis
MSTR Elliott Wave Technical Overview
Function: Trend Analysis
Mode: Impulsive Movement
Structure: Motive Wave
Position: Minor Wave 3
Direction: Upside Continuation into Wave 3
Details: The analysis indicates two possible scenarios: an upside move into wave 3 or a sideways correction in wave (4), potentially leading to a correction in Minor wave 2 instead of Minuette {ii}. The ongoing bullish trend suggests a continuation of the upward trajectory as wave 3 progresses.

TradingLounge MSTR Stock Elliott Wave Analysis - 4H Chart
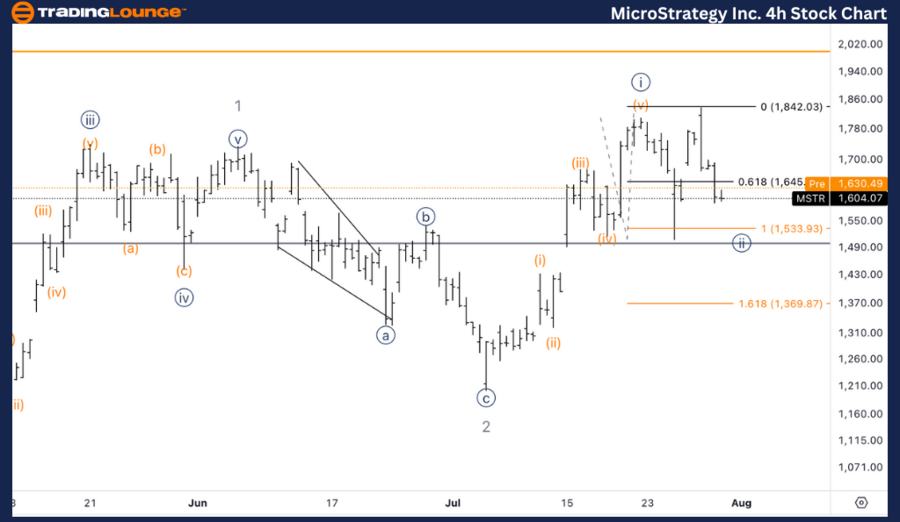
MicroStrategy Inc. (MSTR) 4-Hour Chart Analysis
MSTR Elliott Wave Technical Overview
Function: Trend Analysis
Mode: Impulsive Movement
Structure: Motive Wave
Position: Wave {ii} of 3
Direction: Bottom Formation in Wave {ii}
Details: The 4-hour chart highlights a five-wave move into wave {i}, followed by a corrective wave {ii}. Key support is identified at just above $1500, where the equality of wave (c) compared to wave (a) occurs. This level is crucial as it may mark the end of wave {ii}, potentially leading to the resumption of the upward movement into wave 3.
Technical Analyst: Alessio Barretta
Source: visit Tradinglounge.com and learn From the Experts Join TradingLounge Here
See Previous: Costco Wholesale Corp. (COST) Elliott Wave Technical Analysis
Special Trial Offer - 0.76 Cents a Day for 3 Months! Click here
Access 7 Analysts Over 170 Markets Covered. Chat Room With Support
