04Nov

Iron Ore Commodity Elliott Wave Technical Analysis: Market Trends and Price Outlook for 2024

Iron Ore Elliott Wave Technical Analysis

Iron Ore Elliott Wave Analysis

The SGX TSI Iron Ore Index plays a pivotal role as a benchmark for iron ore market participants, including traders, miners, and steelmakers. It is heavily relied upon for contract settlements and risk management. This index, derived from real-time spot market transactions, is recognized for accurately reflecting market conditions.

In May 2021, the index reached an all-time high of roughly $233 per dry metric ton, driven largely by China’s strong demand and supply-side disruptions. However, this peak led to a substantial correction, causing the index to plummet over 68% to $73 by October 2022. A notable rebound followed, lifting the index to $143.5 by December 2023. In 2024, though, this recovery lost momentum, with the index experiencing another decline of nearly 50% before showing renewed signs of growth in September.

Elliott Wave Perspective

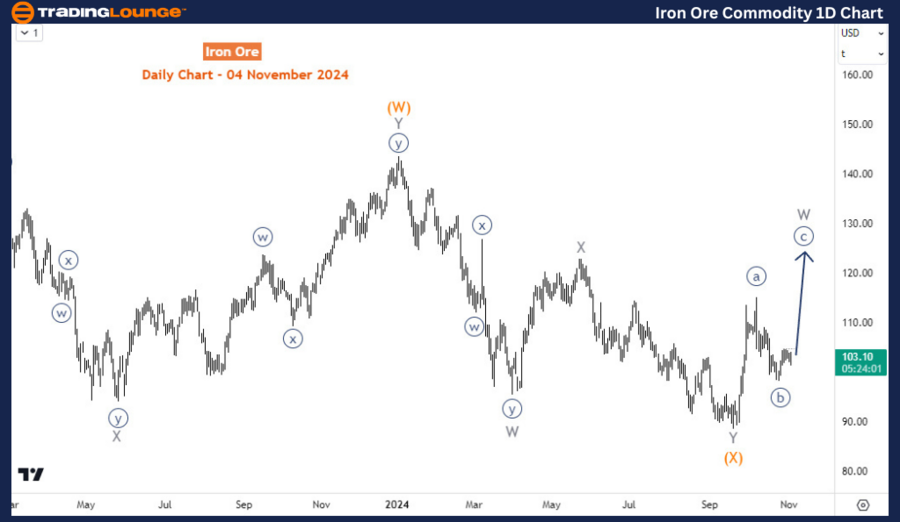
From an Elliott wave analysis, the daily chart illustrates a multi-phase correction beginning from the peak in May 2021. The initial drop completed wave ((W)) of the primary degree, reaching its lowest point at $73.6 in October 2022. This was followed by a bullish zigzag pattern, which concluded in January 2024, before resuming a corrective downtrend. This downward movement appears corrective rather than impulsive, hinting at potential for further upside as the second phase develops, with an anticipated higher target in wave (Y) of X (circled).

Iron-Ore-commodity-1...


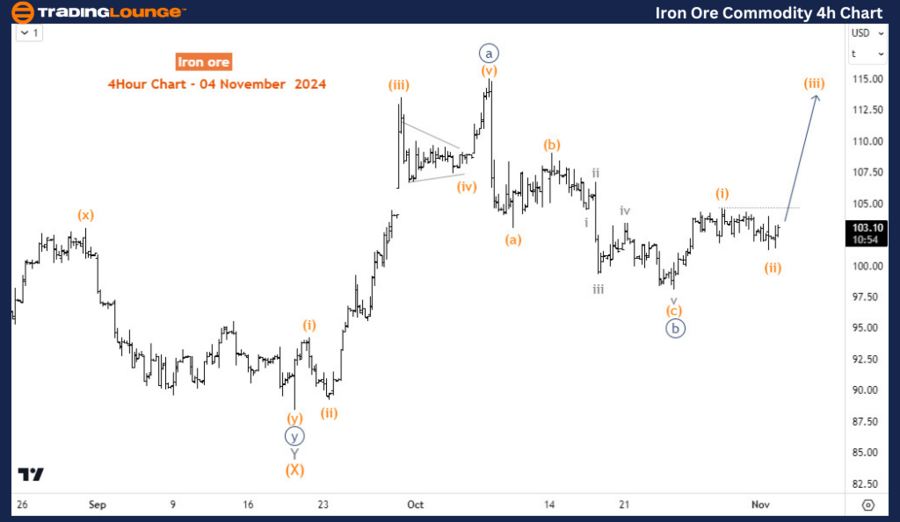
Iron Ore Elliott Wave Analysis: H4 chart

On the H4 chart, we see a closer view of the recovery from September's low, forming a 5-wave impulse structure. Currently, the index is undergoing a 3-wave corrective pullback, labeled as waves ((a)) of ((b)) of W of ((Y)). As long as this pullback stays above the September low, the outlook remains positive for a continuation of the upward trend.

Summary and Trading Outlook

In summary, the SGX TSI Iron Ore Index has experienced a complex correction, but the Elliott wave structure supports a medium-term bullish continuation. Traders might consider a completed pullback as a potential entry signal for wave (Y), with targets set above recent lows.

Technical Analyst: Sanmi Adeagbo

Source: visit Tradinglounge.com and learn From the Experts Join TradingLounge Here 

See Previous: Natural Gas Commodity Elliott Wave Technical Analysis 

VALUE Offer - Buy 1 Month & Get 3 Months!Click here

Access 7 Analysts Over 200 Markets Covered. Chat Room With Support

Iron-Ore-commodity-4...

Related

Euro/British Pound(EURGBP) 4 Hour Chart EURGBP Elliott Wave Technical Analysis 13 October 23

Euro/British Pound(EURGBP) 4 Hour Chart EURGBP Elliott Wave Technical Analysis 13 October 23

The EUR/GBP Elliott Wave Analysis for 13 October 23, serves as a valuable guide for traders and inve...

Read More >
Tesla Inc.(TSLA:NASDAQ) Elliott Wave Technical Analysis 11 January 24

Tesla Inc.(TSLA:NASDAQ) Elliott Wave Technical Analysis 11 January 24

Tesla Inc.(TSLA:NASDAQ) Elliott Wave Technical Analysis 11 January 24 shows TSLA Stock Market Analys...

Read More >
Stay Informed with our Expert Analysis on ASX LIMITED - ASX Stock Analysis & Elliott Wave Technical Forecast

Stay Informed with our Expert Analysis on ASX LIMITED - ASX Stock Analysis & Elliott Wave Technical Forecast

Our detailed Elliott Wave analysis of ASX LIMITED provides valuable insights into current and future...

Read More >
Anticipate the Forex Market Movements for the Australian Dollar against the U.S. Dollar: AUDUSD Elliott Wave Technical Analysis

Anticipate the Forex Market Movements for the Australian Dollar against the U.S. Dollar: AUDUSD Elliott Wave Technical Analysis

This analysis covers the AUDUSD pair using Elliott Wave theory, providing key insights into current ...

Read More >
 AUDUSD Elliott Wave Technical Forecast: Bearish Trend Insights and Key Price Levels

AUDUSD Elliott Wave Technical Forecast: Bearish Trend Insights and Key Price Levels

This in-depth AUDUSD Elliott Wave analysis reveals a bearish trend in the impulsive wave structure, ...

Read More >
Cardano Crypto Price News Today & ADAUSD Elliott Wave Technical Analysis: Corrective Wave II, Forming a Double Corrective Structure

Cardano Crypto Price News Today & ADAUSD Elliott Wave Technical Analysis: Corrective Wave II, Forming a Double Corrective Structure

Cardano (ADA) is currently in Corrective Wave II, forming a double corrective structure. The Fibonac...

Read More >

Buy 1 Month

Get 3 Months!

Special Offer:

Trade Recommendations

Unleash the power of deversified trading with our comprehensive portfolio, covering:

  • Stock Trades
  • Crypto Trades
  • Forex Trades
  • Commodity Trades
Elliott Wave Analysis

Gain a competive edge with expert insights in to:

  • Global Indices
  • US Stocks & ASX Stocks
  • Forex & Crypto
  • Commodities
Top-Notch Trading Tools

Equip yourself with the tools of success:

  • Social Chat
  • Elliott Wave Algorithm
  • Screener
  • TradingLevels
  • Trading Game
7 Elliott Wave Analysts

Stay ahead of the market with daily charts and insightful videos
-Your secret to strategic trading!

JOIN HERE


Welcome to TradingLounge (ASIC A.R.No. 321187), specialists in trades, trading education and technical analysis, covering stocks, indices, commodities, forex and cryptocurrencies.

When you join TradingLounge you have access to everything we offer, including trade tools, educational content and a social platform to chat with like-minded investors.

Read more

@Copyright 2024 by tradinglounge.com

Contact Us

Australian no: 02 4787 6020

International no: +61 (2) 47876020

Pay with:

Find us on