Global X Uranium ETF (URA) Elliott Wave Analysis

Function: Countertrend

Mode: Corrective

Structure: Zigzag for Wave 4; Impulse for Wave (A)

Position: Wave 5 of Wave (A)

Direction: Wave 5 of Wave (A) is still unfolding

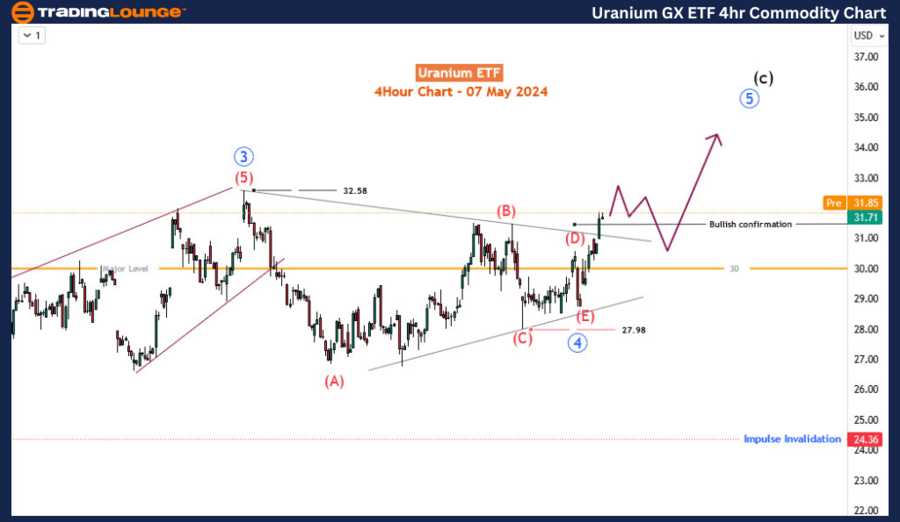
Details: The blue wave 4 triangle is completed, confirmed by the break above wave (B) high. Wave '5' has begun its upward movement. The invalidation level is now set at the wave (E) low. Price could retest the 30 major level before wave '5' of the blue wave series continues.

URA Elliott Wave Technical Analysis

The GX URA ETF, known as the Global X Uranium ETF, is an investment vehicle that reflects the performance of firms in the uranium industry. It provides a diversified portfolio of global companies engaged in uranium mining, exploration, and production. As nuclear power garners interest as a cleaner energy source, with a potential uptick in uranium demand, the GX URA ETF offers investors a unique opportunity to tap into the sector's growth.

After a three-month sideways movement, the URA ETF is attempting an upward breakout. Traders are adding LONG positions and closing SHORT positions to extend the bullish impulse that started in August 2022. The price is anticipated to aim for a new high in 2024, potentially surpassing the February 2024 peak, according to Elliott Wave projections.

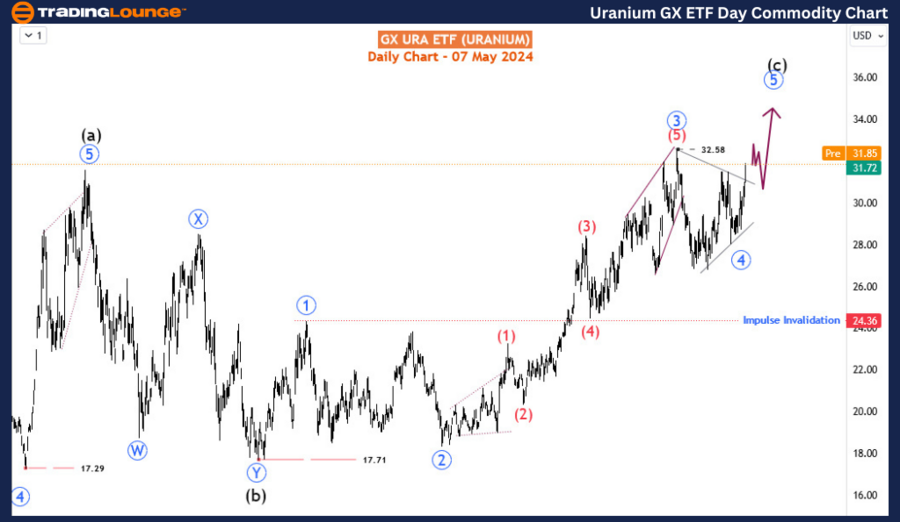
GX Uranium ETF (URA) Day Chart Analysis:

The daily chart reveals a clear bullish impulse wave pattern beginning at 17.71 in August 2022. It completed the 3rd wave - primary wave 5 (marked in blue) in February 2024 and then moved sideways to form a triangle for the 4th wave - blue wave 4. The blue wave 5 is emerging and is anticipated to reach a new yearly high.

GX-Uranium-Day-commo...


GX Uranium ETF (URA) 4-Hour Chart Analysis:

The H4 chart illustrates the sub-waves of the triangle 4th wave, divided into five 3-wave patterns between two contracting lines. The primary degree wave 5 (marked in blue) is projected to advance toward 36-36. However, the price could dip toward the 30.00 major level before the rally progresses further. This projection holds as long as the price remains above the 27.98 major level.

Technical Analyst: Sanmi Adeagbo

Source: visit Tradinglounge.com and learn From the Experts Join TradingLounge Here 

See Previous: Cocoa Commodity Elliott Wave Technical Analysis

Special Trial Offer - 0.76 Cents a Day for 3 Months! Click here

Access 6 Analysts covering over 150 Markets. Chat Room With Support

GX-Uranium-4hr-commo...

Related

 Mastercard Inc. (MA) Elliott Wave Technical Analysis: Technical Insights, Stock Forecast, and Trading Strategy

Mastercard Inc. (MA) Elliott Wave Technical Analysis: Technical Insights, Stock Forecast, and Trading Strategy

This article provides a comprehensive Elliott Wave analysis of Mastercard Inc. (MA), covering daily ...

Read More >
EUR/USD Elliott Wave Analysis Reveals Bullish Impulse Pattern Suggesting Continued Uptrend in Forex Market

EUR/USD Elliott Wave Analysis Reveals Bullish Impulse Pattern Suggesting Continued Uptrend in Forex Market

The EUR/USD pair exhibits a bullish impulsive pattern according to Elliott Wave analysis, indicating...

Read More >
Theta token/ U.S. dollar(THETAUSD) Elliott Wave Technical Analysis 12 December 23

Theta token/ U.S. dollar(THETAUSD) Elliott Wave Technical Analysis 12 December 23

TradingLounge Day and 4H Chart of Theta token/ U.S. dollar(THETAUSD) Elliott Wave Technical Analysis...

Read More >
Navigating Corrections for Trading Success Alphabet Inc.,(GOOGL) Elliott Wave Technical Analysis

Navigating Corrections for Trading Success Alphabet Inc.,(GOOGL) Elliott Wave Technical Analysis

As of February 27, 2024, Alphabet Inc. (GOOGL) presents intriguing opportunities for traders amidst ...

Read More >
Commodity Market Report  Elliott Wave Analysis

Commodity Market Report Elliott Wave Analysis

Commodities | Latest News & Elliott Wave Analysis: US Bond Yields, Forex USDJPY, EURUSD, GBPUSD, AUD...

Read More >
Elliott Wave Analysis for JP Morgan & Chase Co. (JPM), Focusing on Both Saily and 1-Hour Charts, Highlights Key Trading Levels

Elliott Wave Analysis for JP Morgan & Chase Co. (JPM), Focusing on Both Saily and 1-Hour Charts, Highlights Key Trading Levels

This article provides a comprehensive Elliott Wave analysis for JP Morgan & Chase Co. (JPM), focusin...

Read More >

$1 for 2 Weeks

then $29 a month!

What a Special Offer!

Trade Recommendations

Unleash the power of deversified trading with our comprehensive portfolio, covering 250+ markets:

  • Stock Trades
  • Crypto Trades
  • Forex Trades
  • Commodity Trades
Elliott Wave Analysis

Gain a competitive edge with expert insights and AI-powered Elliott Wave charting into:

  • Global Indices
  • US Stocks & ASX Stocks
  • Forex & Crypto
  • Commodities
Top-Notch Trading Tools

Equip yourself with the tools of success:

  • Real-time Chat rooms
  • Elliott Wave Algorithm
  • Portfolio tools
  • TradingLevels
  • Screener
  • Trading Game
7 Elliott Wave Analysts

Stay ahead of the market with daily charts and insightful videos
Your secret to strategic trading!

JOIN HERE


Welcome to TradingLounge (ASIC A.R.No. 321187), specialists in trades, trading education and technical analysis, covering stocks, indices, commodities, forex and cryptocurrencies.

When you join TradingLounge you have access to everything we offer, including trade tools, educational content and a social platform to chat with like-minded investors.

Read more

@Copyright 2024 by tradinglounge.com

Contact Us

Australian no: 02 4787 6020

International no: +61 (2) 47876020

Pay with:

Find us on