11Feb

Bajaj Finserv Stock Analysis: Will Elliott Wave Theory Predict the Next Big Move? Price Prediction, Trend & Key Support Levels Uncovered!

BAJAJFINSV Elliott Wave Analysis - TradingLounge 1D Chart

BAJAJ FINSERVE 1D Chart Analysis

BAJAJFINSV Elliott Wave Technical Analysis

Function: Counter Trend (Minor Degree – Grey)

Mode: Corrective

Structure: Impulse within Larger Degree Correction

Position: Minor Wave 3 – Grey

BAJAJ FINSERVE Technical Details:

  • Minor Wave 2 appears to have concluded just below the ₹1,900 level.

  • If this count holds, Minor Wave 3 could be in progress, with a break below ₹1,540 potentially accelerating downside momentum.

Invalidation Point: ₹2,040

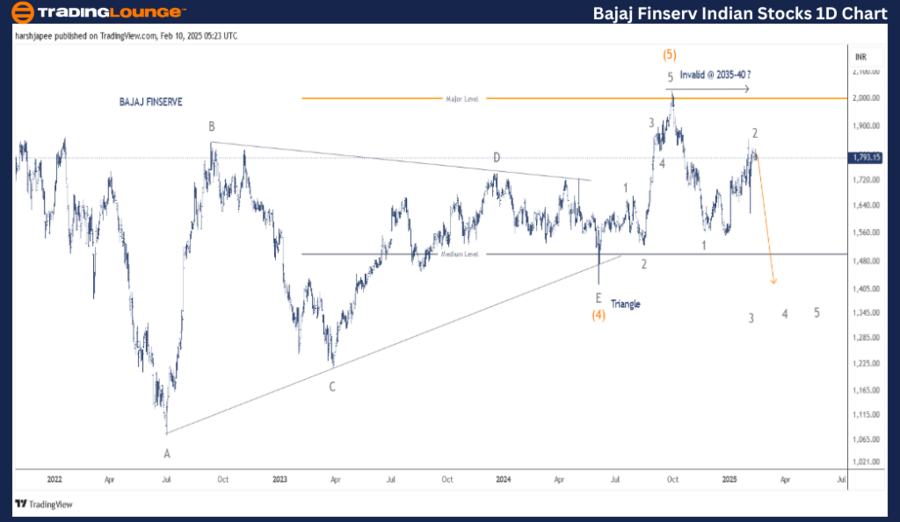
BAJAJ FINSRV Daily Chart Analysis & Elliott Wave Projections

The BAJAJ FINSRV daily chart suggests a potential top formation around the ₹2,035–₹2,040 zone, marking the end of Intermediate Wave (5) – Orange. Notably, Wave (4) developed as a triangle consolidation pattern, lasting approximately two years before terminating near ₹1,420 in June 2024.

Since touching the ₹2,035 level, the stock has reversed lower, indicating bearish control. The price structure and Elliott Wave counts since September 2024 hint at Minor Wave 1 ending around ₹1,560, followed by Minor Wave 2 near ₹1,900.

For bears to maintain dominance, prices should ideally stay below ₹1,850–₹1,860, reinforcing the unfolding of Minor Wave 3.

Bajaj-Finserv-Indian...


BAJAJ FINSERVE – BAJAJFINSV (4H Chart) Elliott Wave Technical Analysis

Function: Counter Trend (Minor Degree – Grey)

Mode: Corrective

Structure: Impulse within Larger Degree Correction

Position: Minor Wave 3 – Grey

BAJAJ FINSERVE Technical Details:

  • Minor Wave 2 likely concluded just below ₹1,900.

  • Minor Wave 1 subdivided into five Minute-degree waves, while Wave 2 unfolded as an expanded flat.
  • If the analysis holds, Minor Wave 3 may already be in progress, with a drop below ₹1,540 strengthening the bearish outlook.

Invalidation Point: ₹2,040

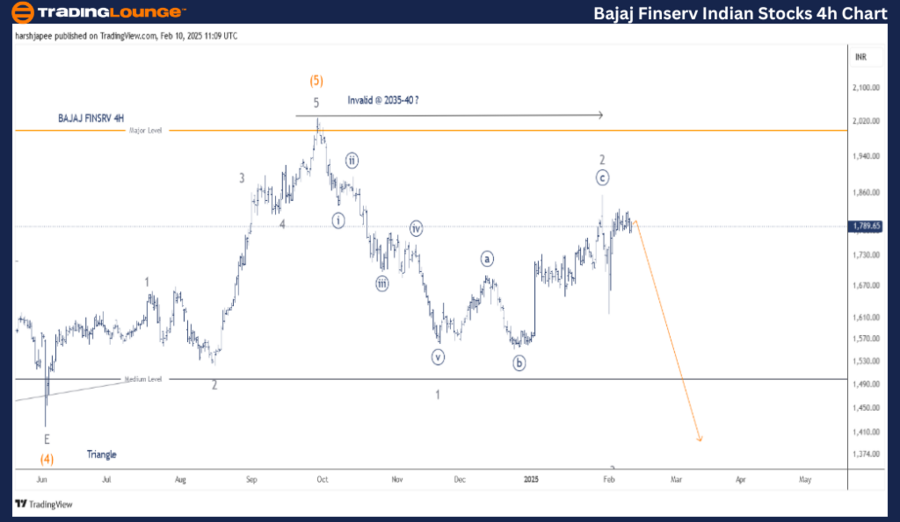
BAJAJ FINSRV 4H Chart Analysis & Elliott Wave Projections

The 4H chart provides a clearer view of sub-waves following the completion of Intermediate Wave (4) – Orange, which terminated around ₹1,420 in June 2024. Intermediate Wave (5) rallied sharply towards the ₹2,035–₹2,040 range before reversing.

The stock then carved a Minor Wave 1 impulse, ending at ₹1,560. The subsequent corrective rally developed into an expanded flat, marking potential Minor Wave 2 around ₹1,850–₹1,860.

If this structure holds, Minor Wave 3 could already be unfolding, with a potential downside target of ₹1,075, aligning with the triangle consolidation zone.

Technical Analyst: Harsh Japee

Source: visit Tradinglounge.com and learn From the Experts Join TradingLounge Here 

Previous: ADANI GREEN ENERGY Elliott Wave Technical Analysis

VALUE Offer - Buy 1 Month & Get 3 Months!Click here

Access 7 Analysts Over 200 Markets Covered. Chat Room With Support

Bajaj-Finserv-Indian...


Conclusion:

BAJAJ FINSRV appears to be unfolding Minor Wave 3 lower, potentially targeting ₹1,420 and beyond, while maintaining resistance around the ₹2,035–₹2,040 highs. A confirmed break below ₹1,540 could further accelerate the decline.

Related

Bull Market Elliott Wave Trading Strategies SP500, NASDAQ, DAX 40, FTSE 100, ASX 200 - Trading Lounge

Bull Market Elliott Wave Trading Strategies SP500, NASDAQ, DAX 40, FTSE 100, ASX 200 - Trading Lounge

Elliott Wave analysis highlights a bullish structure in the S&P 500, strength in banks, and a weaker...

Read More >
Elliott Wave Analysis of BLOCK INC (ASX:SQ2): Projecting Wave 3 Targets and Identifying Key Support for Bullish Continuation

Elliott Wave Analysis of BLOCK INC (ASX:SQ2): Projecting Wave 3 Targets and Identifying Key Support for Bullish Continuation

This analysis provides an in-depth Elliott Wave examination of BLOCK INC (ASX:SQ2), focusing on the ...

Read More >
U.S. Dollar / Japanese Yen (USDJPY) Forex Elliott Wave Technical Analysis: Insight to Forecast Potential Market Moves

U.S. Dollar / Japanese Yen (USDJPY) Forex Elliott Wave Technical Analysis: Insight to Forecast Potential Market Moves

This article provides a comprehensive Elliott Wave analysis for USDJPY, covering both the daily and ...

Read More >
Accurate Forecasts and Comprehensive Commodity Market Outlooks: WTI Crude Oil Commodity Elliott Wave Technical Analysis

Accurate Forecasts and Comprehensive Commodity Market Outlooks: WTI Crude Oil Commodity Elliott Wave Technical Analysis

This article provides an in-depth WTI Crude Oil analysis using Elliott Wave theory. Learn about the ...

Read More >
Detailing the Current Market Phases on both Daily and Weekly Charts: NIFTY 50(INDIA) Indices Elliott Wave Technical Analysis

Detailing the Current Market Phases on both Daily and Weekly Charts: NIFTY 50(INDIA) Indices Elliott Wave Technical Analysis

This article provides a thorough Elliott Wave analysis of the NIFTY 50 (India) index, detailing the ...

Read More >
VeChain (VETUSD) Elliott Wave Analysis: Identifying Profitable Trends and Trading Strategies

VeChain (VETUSD) Elliott Wave Analysis: Identifying Profitable Trends and Trading Strategies

VeChain (VETUSD) trading opportunities with Elliott Wave analysis provided by TradingLounge. Explore...

Read More >

$1 for 2 Weeks

then $29 a month!

What a Special Offer!

Trade Recommendations

Unleash the power of deversified trading with our comprehensive portfolio, covering 250+ markets:

  • Stock Trades
  • Crypto Trades
  • Forex Trades
  • Commodity Trades
Elliott Wave Analysis

Gain a competitive edge with expert insights and AI-powered Elliott Wave charting into:

  • Global Indices
  • US Stocks & ASX Stocks
  • Forex & Crypto
  • Commodities
Top-Notch Trading Tools

Equip yourself with the tools of success:

  • Real-time Chat rooms
  • Elliott Wave Algorithm
  • Portfolio tools
  • TradingLevels
  • Screener
  • Trading Game
7 Elliott Wave Analysts

Stay ahead of the market with daily charts and insightful videos
Your secret to strategic trading!

JOIN HERE


Welcome to TradingLounge (ASIC A.R.No. 321187), specialists in trades, trading education and technical analysis, covering stocks, indices, commodities, forex and cryptocurrencies.

When you join TradingLounge you have access to everything we offer, including trade tools, educational content and a social platform to chat with like-minded investors.

Read more

@Copyright 2024 by tradinglounge.com

Contact Us

Australian no: 02 4787 6020

International no: +61 (2) 47876020

Pay with:

Find us on