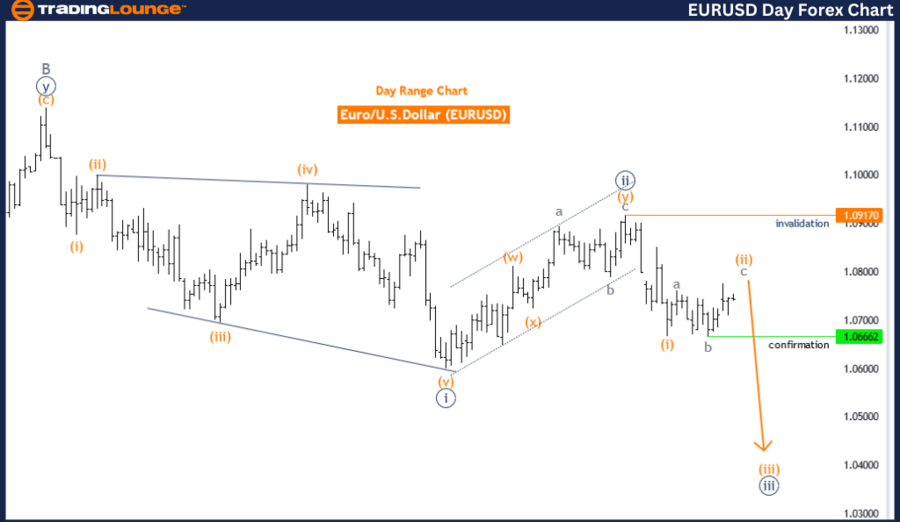
Euro/U.S.Dollar (EURUSD) Elliott Wave Analysis - Daily Chart
Euro/U.S.Dollar Daily Chart Analysis
EURUSD Elliott Wave Technical Analysis
Trend Function: Trend
Mode: Corrective
Structure: Orange Wave 2
Position: Navy Blue Wave 3
Direction for Next Lower Degrees: Orange Wave 3
Details: Orange Wave 1 completed at 1.06672, Orange Wave 2 nearing end.
Wave Cancel Invalid Level: 1.09170
The EURUSD Elliott Wave analysis on the daily chart indicates a corrective trend function. This suggests a temporary market reversal or consolidation rather than a continuation of the primary direction.
Wave Structure:
- Orange Wave 2: Follows the completion of Orange Wave 1.
- Navy Blue Wave 3 Position: Prepares the market to transition into the third wave of a larger navy blue wave sequence.
Key Points:
- Wave 2: Typically a retracement phase, correcting the initial impulse wave (Wave 1) before continuing the primary trend.
- Wave 3: Often the most dynamic and extended wave, characterized by significant movement in the direction of the trend.
Next Direction:
- Orange Wave 3: After Orange Wave 2 is complete, the market is expected to start a strong upward movement as part of Orange Wave 3. This wave is usually the most powerful, indicating a continuation of the primary trend.
Analysis Details:
- Orange Wave 1: Completed at 1.06672.
- Orange Wave 2: Nearing its end, signaling the end of the corrective phase and the start of Orange Wave 3.
- Wave Cancel Invalid Level: Set at 1.09170. If the market exceeds this level, the current wave count will be invalidated, requiring a reassessment of the wave structure.
Summary:
The EURUSD on the daily chart is in a corrective phase within Orange Wave 2, nearing completion. The market is expected to start Orange Wave 3, indicating a strong upward movement. The wave cancel invalid level is 1.09170, beyond which the current analysis would need reconsideration.
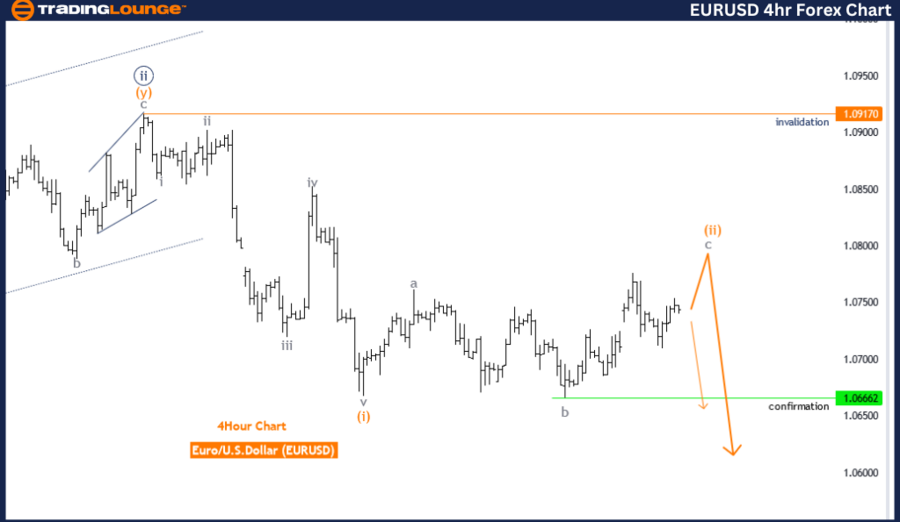
Euro/U.S.Dollar Elliott Wave Analysis - 4-Hour Chart
EURUSD Elliott Wave Technical Analysis
Trend Function: Trend
Mode: Corrective
Structure: Orange Wave 2
Position: Navy Blue Wave 3
Direction for Next Lower Degrees: Orange Wave 3
Details: Orange Wave 1 completed at 1.06672, Orange Wave 2 nearing end.
Wave Cancel Invalid Level: 1.09170
The EURUSD Elliott Wave analysis on the 4-hour chart suggests a trend function in corrective mode, indicating a temporary reversal or consolidation rather than a continuation of the primary trend.
Wave Structure:
- Orange Wave 2: Part of the corrective phase following the completion of Orange Wave 1.
- Navy Blue Wave 3 Position: The market is expected to transition into the third wave of a larger navy blue wave sequence.
Key Points:
- Wave 2: Typically a retracement phase, correcting the initial impulse wave (Wave 1) and setting the stage for Wave 3.
- Wave 3: Usually the most dynamic and extended wave, characterized by significant movement in the trend’s direction.
Next Direction:
- Orange Wave 3: After the completion of Orange Wave 2, the market is anticipated to begin a strong upward movement as part of Orange Wave 3. This wave is generally the most powerful in the Elliott Wave cycle.
Analysis Details:
- Orange Wave 1: Completed at 1.06672.
- Orange Wave 2: Nearing its end, signaling the conclusion of the corrective phase and the onset of Orange Wave 3.
- Wave Cancel Invalid Level: Set at 1.09170. If the market exceeds this level, the current wave count will be invalidated, requiring a reevaluation of the wave structure.
Summary:
The EURUSD on the 4-hour chart is currently in a corrective phase within Orange Wave 2. This wave is nearing completion, and the market is expected to start Orange Wave 3, indicating a strong upward movement. The wave cancel invalid level is 1.09170, beyond which the current analysis would need reassessment.
Technical Analyst: Malik Awais
Source: visit Tradinglounge.com and learn From the Experts Join TradingLounge Here
Previous: AUDJPY Elliott Wave Technical Analysis
Special Trial Offer - 0.76 Cents a Day for 3 Months! Click here
Access 7 Analysts Over 170 Markets Covered. Chat Room With Support