22Aug

PaloAlto Networks Inc. stock price towards key levels: PANW Elliott Wave Technical Analysis and Potential Upside

Welcome to Our Latest Elliott Wave Analysis for Palo Alto Networks Inc. (PANW)

This report presents an in-depth analysis of PANW's price movements using Elliott Wave Theory. The goal is to help traders identify potential trading opportunities based on the current trend and wave structure of the stock. We will review both the daily and 1-hour charts to provide a well-rounded view of PANW’s market behavior.

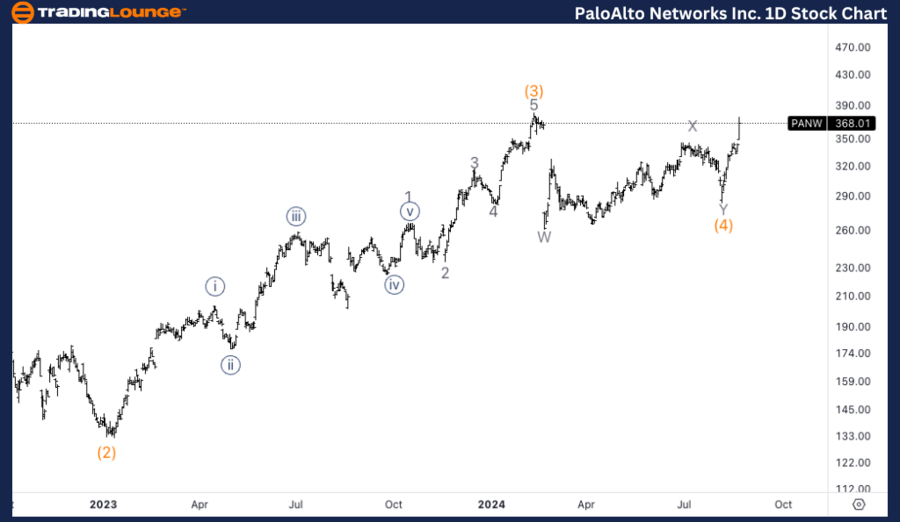
PANW Elliott Wave Analysis: Trading Lounge Daily Chart

Palo Alto Networks Inc. (PANW) Daily Chart Analysis

PANW Technical Analysis

Function: Trend

Mode: Impulsive

Structure: Motive

Position: Intermediate (5)

Direction: Upside into wave (5)

Details: We anticipate an upward movement into wave (5) as PANW appears to have reached a bottom in wave (4). The stock is now expected to move towards the Medium Level at $400.

PANW Elliott Wave Technical Analysis – Daily Chart

PANW seems to be advancing into the final wave (5) of the current impulsive cycle after bottoming in wave (4). The upward momentum is likely to persist, targeting the Medium Level at $400. The recent price actions align with the outlook for continued gains as the stock progresses towards completing wave (5).

PaloAlto-Networks-In...


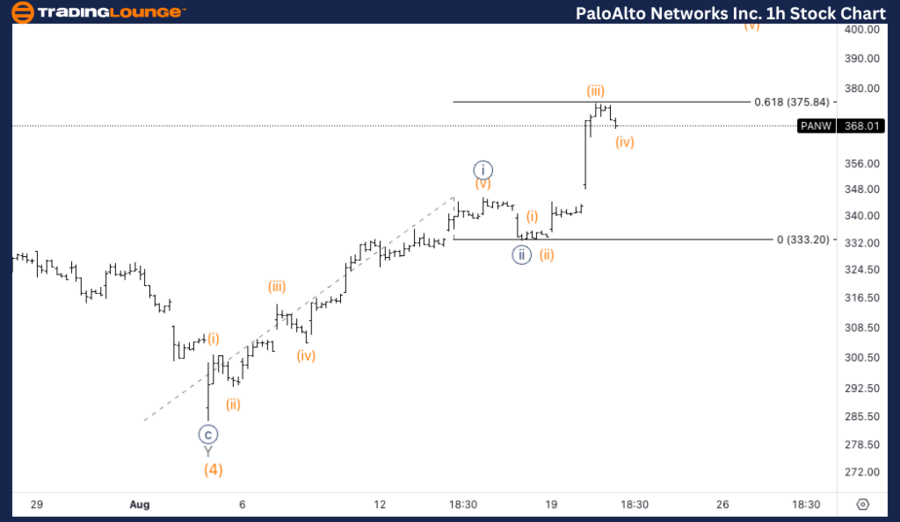
PANW Elliott Wave Analysis: Trading Lounge 1H Chart

Palo Alto Networks Inc. (PANW) 1H Chart Analysis

PANW Elliott Wave Technical Analysis

Function: Trend

Mode: Impulsive

Structure: Motive

Position: Wave {iii} of 1

Direction: Upside in wave {iii}

Details: We are looking for continued upside in wave {iii} after observing the highest RSI reading at the $375 top. This high RSI level suggests that it could be the third wave of a third, typically the most extended and powerful in an Elliott Wave sequence.

PANW Stock Technical Analysis – 1H Chart

PANW is currently moving higher within wave {iii} of 1, with the highest RSI reading near the $375 level. This RSI peak indicates that this move may be part of a third wave, often the strongest in the Elliott Wave sequence, reinforcing expectations for further upside as wave {iii} develops.

Technical Analyst: Alessio Barretta

Source: visit Tradinglounge.com and learn From the Experts Join TradingLounge Here 

See Previous: Texas Instruments Inc. (TXN) Elliott Wave Technical Analysis

Special Trial Offer - 0.76 Cents a Day for 3 Months! Click here

Access 7 Analysts Over 200 Markets Covered. Chat Room With Support

PaloAlto-Networks-In...

Related

DOTUSD Elliott Wave Analysis: Polkadot Price Prediction, Trading Strategy, Market Trends, Support and Resistance Levels Insights

DOTUSD Elliott Wave Analysis: Polkadot Price Prediction, Trading Strategy, Market Trends, Support and Resistance Levels Insights

DOTUSD Elliott Wave analysis offers valuable insights into Polkadot's price prediction, trading ...

Read More >
Gain expert insights into Binance Crypto Price BNBUSD Elliott Wave Technical Analysis

Gain expert insights into Binance Crypto Price BNBUSD Elliott Wave Technical Analysis

Gain expert insights into Binance Coin (BNBUSD) with our detailed Elliott Wave Analysis. Understand ...

Read More >
Tata Consumer Product Stocks Elliott Wave Technical Analysis and Tata Share Current Trend, Potential Price Movement

Tata Consumer Product Stocks Elliott Wave Technical Analysis and Tata Share Current Trend, Potential Price Movement

This article provides a comprehensive analysis of Tata Consumer Product using Elliott Wave theory. I...

Read More >
Coca-Cola Company (KO) Elliott Wave Technical Analysis: KO stock trends with Daily & 4Hr Charts

Coca-Cola Company (KO) Elliott Wave Technical Analysis: KO stock trends with Daily & 4Hr Charts

In the realm of Elliott Wave Analysis, The Coca-Cola Company (KO) is under scrutiny, with a focus on...

Read More >
Develop Effective Trading Strategies and TRON's Crypto Price Movement with TRXUSD Elliott Wave Technical Analysis

Develop Effective Trading Strategies and TRON's Crypto Price Movement with TRXUSD Elliott Wave Technical Analysis

Gain valuable insights into TRXUSD with comprehensive Elliott Wave analysis, helping you predict TRO...

Read More >
Bullish Trend in Gold Commodity Provides a Detailed Chart Analysis Using Gold (XAUUSD) Elliott Wave Technical Analysis

Bullish Trend in Gold Commodity Provides a Detailed Chart Analysis Using Gold (XAUUSD) Elliott Wave Technical Analysis

This article provides a comprehensive Gold Elliott Wave Analysis, focusing on predicting Gold price ...

Read More >

$1 for 2 Weeks

then $29 a month!

What a Special Offer!

Trade Recommendations

Unleash the power of deversified trading with our comprehensive portfolio, covering 250+ markets:

  • Stock Trades
  • Crypto Trades
  • Forex Trades
  • Commodity Trades
Elliott Wave Analysis

Gain a competitive edge with expert insights and AI-powered Elliott Wave charting into:

  • Global Indices
  • US Stocks & ASX Stocks
  • Forex & Crypto
  • Commodities
Top-Notch Trading Tools

Equip yourself with the tools of success:

  • Real-time Chat rooms
  • Elliott Wave Algorithm
  • Portfolio tools
  • TradingLevels
  • Screener
  • Trading Game
7 Elliott Wave Analysts

Stay ahead of the market with daily charts and insightful videos
Your secret to strategic trading!

JOIN HERE


Welcome to TradingLounge (ASIC A.R.No. 321187), specialists in trades, trading education and technical analysis, covering stocks, indices, commodities, forex and cryptocurrencies.

When you join TradingLounge you have access to everything we offer, including trade tools, educational content and a social platform to chat with like-minded investors.

Read more

@Copyright 2024 by tradinglounge.com

Contact Us

Australian no: 02 4787 6020

International no: +61 (2) 47876020

Pay with:

Find us on