23Jan

DOTUSD Elliott Wave Analysis: Polkadot Price Prediction, Trading Strategy, Market Trends, Support and Resistance Levels Insights

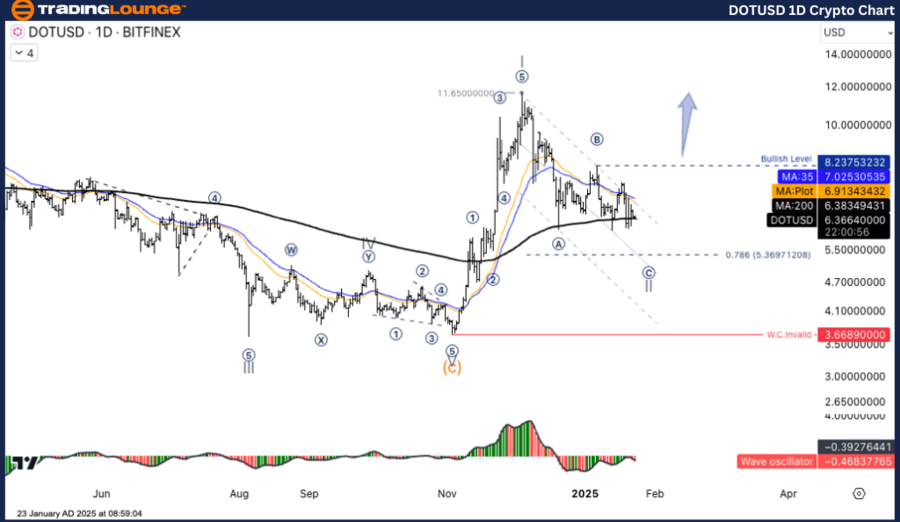
DOT/USD (DOTUSD) Elliott Wave Technical Analysis - TradingLounge 1D Chart Analysis

DOTUSD Elliott Wave Technical Analysis Overview

Function: Counter Trend

Mode: Corrective

Structure: Zigzag

Position: Wave ((C))

Next Higher Degree Direction: Wave II

Wave Invalidation Level: N/A

DOT/USD Trading Strategy Overview
DOT/USD is currently in a Wave II corrective structure, following the classic A-B-C pattern.

  • Wave A: A strong pullback from recent highs.
  • Wave B: Ongoing rebound phase.
  • Wave C: Anticipated to extend further into the lower target zone.

Traders should monitor the 5.3691 support zone, which will help determine whether the price is approaching the completion phase of Wave II.

Key Forecasts and Market Outlook

  • Short-term: The price is projected to continue downward in Wave C, potentially testing the key support level of 5.3691.
  • Mid-term: The corrective move in Wave C could push prices down to test the major support at 0.650.
  • Long-term: If Wave II completes, an upward movement in the larger Wave III may initiate, signaling a potential bullish trend.

DOTUSD-1d-crypto-cha...


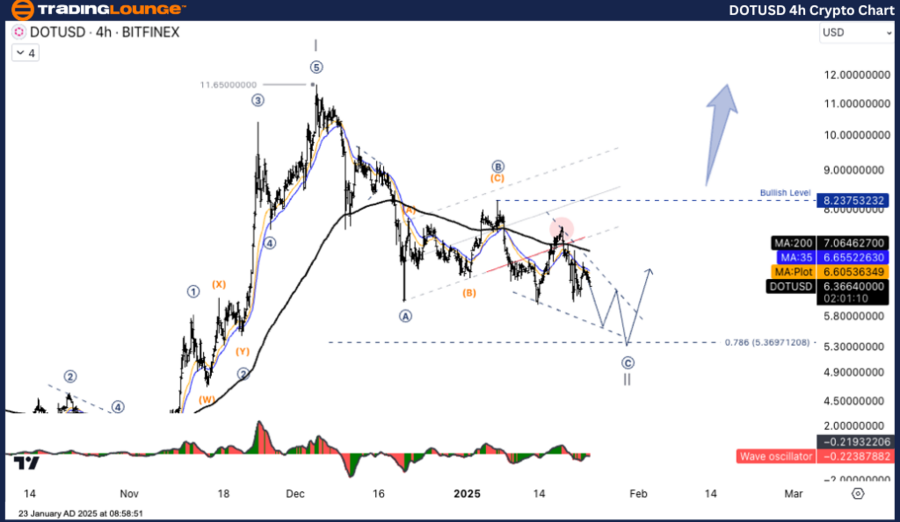
DOT/USD (DOTUSD) Elliott Wave Technical Analysis - TradingLounge 4H Chart Analysis

DOTUSD Elliott Wave Technical Analysis Overview

Function: Counter Trend

Mode: Corrective

Structure: Zigzag

Position: Wave ((C))

Next Higher Degree Direction: Wave II

Wave Invalidation Level: N/A

DOT/USD Trading Strategy Overview
The market remains in a Wave II corrective phase, structured in an A-B-C corrective sequence.

  • Wave A: Experienced a significant decline from previous highs.
  • Wave B: Current rebound phase observed.
  • Wave C: Expected to extend lower, reaching the targeted support zone.

Traders should closely monitor the 5.3691 support level, ensuring that the corrective pattern aligns with the expected end of Wave II.

Key Forecasts and Market Outlook

  • Short-term: Anticipated downward correction in Wave C, with a focus on the 5.3691 support level.
  • Mid-term: Further downside risk remains, with support potentially being tested at 0.650.
  • Long-term: If the corrective Wave II finalizes, a bullish reversal towards Wave III may emerge.

Technical Analyst: Kittiampon Somboonsod

Source: visit Tradinglounge.com and learn From the Experts Join TradingLounge Here 

Previous: THETAUSD Elliott Wave Technical Analysis

VALUE Offer - Buy 1 Month & Get 3 Months!Click here

Access 7 Analysts Over 200 Markets Covered. Chat Room With Support

DOTUSD-4h-crypto-cha...

Related

Navigating Stock Market Indices with Elliott Wave Analysis: SP500, NASDAQ 100, RUSSELL 2000, and More

Navigating Stock Market Indices with Elliott Wave Analysis: SP500, NASDAQ 100, RUSSELL 2000, and More

This blog explores the current state of major stock market indices, including the S&P 500, NASDAQ 10...

Read More >
THETAUSD Elliott Wave Technical Analysis: Theta/U.S. Dollar Pair Highlights Critical Support and Resistance Levels

THETAUSD Elliott Wave Technical Analysis: Theta/U.S. Dollar Pair Highlights Critical Support and Resistance Levels

This article provides an in-depth THETAUSD Elliott Wave analysis, covering the latest price trends, ...

Read More >
GBPUSD Accurate Trend and Market Forecasts: British Pound/U.S. Dollar Forex Elliott Wave Technical Analysis

GBPUSD Accurate Trend and Market Forecasts: British Pound/U.S. Dollar Forex Elliott Wave Technical Analysis

The GBPUSD Elliott Wave analysis provides comprehensive insights into market movements and projectio...

Read More >
USDCHF Elliott Wave Technical Analysis Highlighting Navy Blue Wave 2, Orange Wave C, Critical Levels, and Market Dynamics for Traders

USDCHF Elliott Wave Technical Analysis Highlighting Navy Blue Wave 2, Orange Wave C, Critical Levels, and Market Dynamics for Traders

This comprehensive analysis of USDCHF highlights Elliott Wave structures, focusing on Navy Blue Wave...

Read More >
Elliott Wave Analysis for News Corporation (ASX:NWS) with Stock Forecast, Wave Counts, Technical Levels, and Trading Strategy Insights

Elliott Wave Analysis for News Corporation (ASX:NWS) with Stock Forecast, Wave Counts, Technical Levels, and Trading Strategy Insights

Elliott Wave analysis of News Corporation (ASX:NWS), highlighting current corrective wave structures...

Read More >
ASX LNW Stock Analysis and Elliott Wave Forecast for Light & Wonder Inc. Share Price Trends, Market Outlook & Trading Strategies

ASX LNW Stock Analysis and Elliott Wave Forecast for Light & Wonder Inc. Share Price Trends, Market Outlook & Trading Strategies

ASX LNW stock analysis offers a comprehensive Elliott Wave forecast for Light & Wonder Inc., coverin...

Read More >

Buy 1 Month

Get 3 Months!

Special Offer:

Trade Recommendations

Unleash the power of deversified trading with our comprehensive portfolio, covering:

  • Stock Trades
  • Crypto Trades
  • Forex Trades
  • Commodity Trades
Elliott Wave Analysis

Gain a competive edge with expert insights in to:

  • Global Indices
  • US Stocks & ASX Stocks
  • Forex & Crypto
  • Commodities
Top-Notch Trading Tools

Equip yourself with the tools of success:

  • Social Chat
  • Elliott Wave Algorithm
  • Screener
  • TradingLevels
  • Trading Game
7 Elliott Wave Analysts

Stay ahead of the market with daily charts and insightful videos
-Your secret to strategic trading!

JOIN HERE


Welcome to TradingLounge (ASIC A.R.No. 321187), specialists in trades, trading education and technical analysis, covering stocks, indices, commodities, forex and cryptocurrencies.

When you join TradingLounge you have access to everything we offer, including trade tools, educational content and a social platform to chat with like-minded investors.

Read more

@Copyright 2024 by tradinglounge.com

Contact Us

Australian no: 02 4787 6020

International no: +61 (2) 47876020

Pay with:

Find us on