Cocoa Commodity Elliott Wave Technical Analysis
Cocoa Elliott Wave Analysis
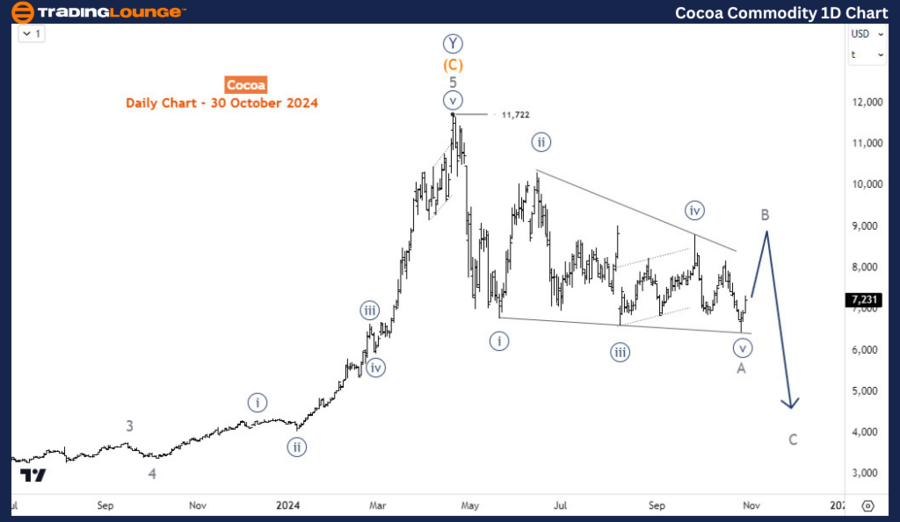
After peaking at an all-time high of 11,722 in April 2024, cocoa prices have fallen over 40% within six months. Given the extended rally from November 2022 to April 2024, a correction was anticipated. But what structural patterns are shaping the current corrective phase, and could the decline deepen further?
Cocoa Commodity Daily Chart Analysis
Elliott wave theory suggests that corrections typically form in a 3-wave structure, except for triangles, which subdivide into five distinct 3-wave structures. The recent decline from 11,722 seems to have completed a leading diagonal, identified here as wave A. Therefore, the current bounce could likely extend upward within any of the corrective structures before another downturn in wave C. With this outlook, the full corrective phase from the 11,722 peak is projected to reach around 5,000 before the long-term upward trend resumes.

Cocoa Commodity H4 Chart Analysis
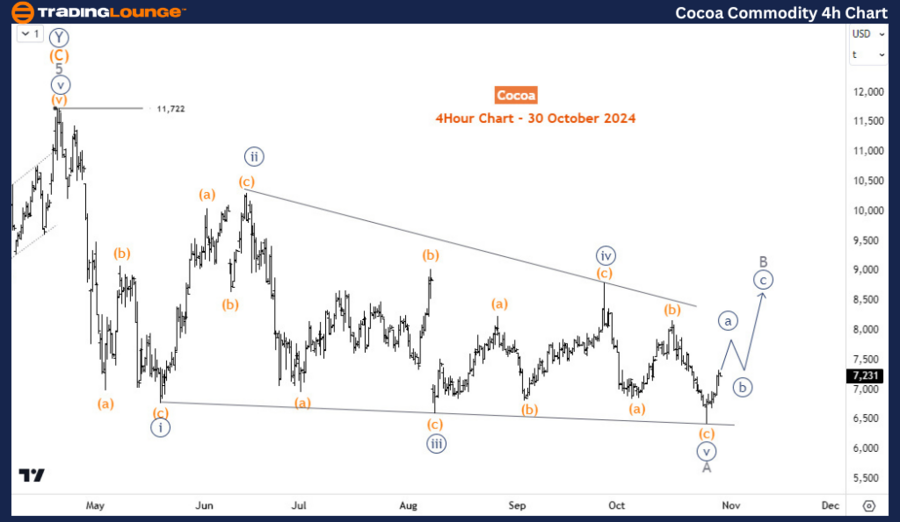
On the H4 chart, wave B is anticipated to form a bounce in at least a 3-wave zigzag, flat, or potentially a 5-wave triangle. It’s too early to determine the exact pattern for wave B. However, once a clear corrective structure completes, sellers may gain confidence in driving prices lower in wave C, potentially approaching the 5,000 level.
Technical Analyst: Sanmi Adeagbo
Source: visit Tradinglounge.com and learn From the Experts Join TradingLounge Here
See Previous: GX Uranium ETF Elliott Wave Technical Analysis
VALUE Offer - Buy 1 Month & Get 3 Months!Click here
Access 7 Analysts Over 200 Markets Covered. Chat Room With Support
