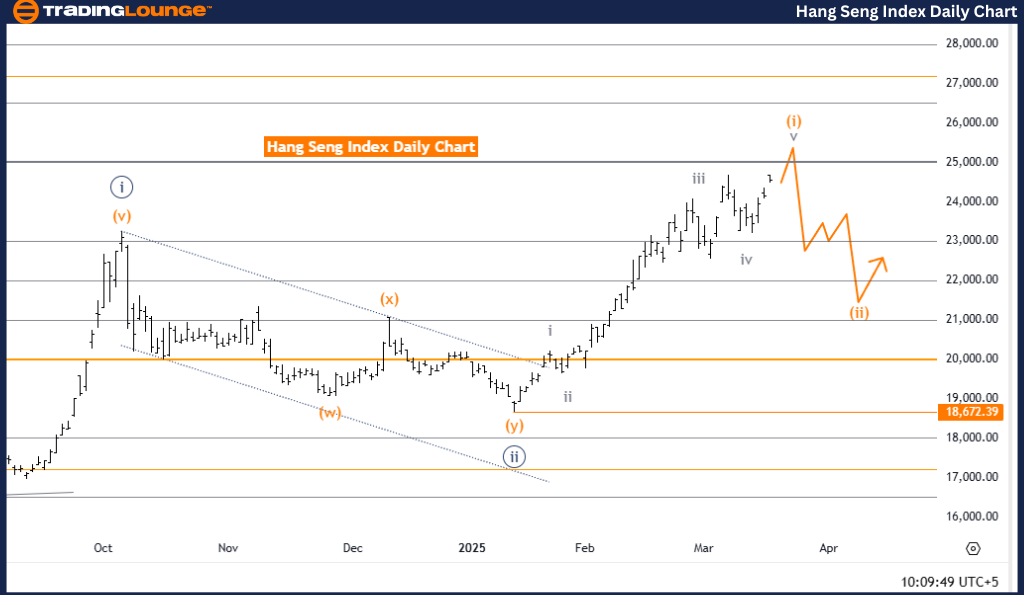
Hang Seng Index Elliott Wave Analysis – Trading Lounge Day Chart
Hang Seng Index Wave Technical Analysis
Function: Bullish Trend
Mode: Impulsive
Structure: Orange Wave 1
Position: Navy Blue Wave 3
Next Lower Degree Direction: Orange Wave 2
Wave Cancel Invalidation Level: 18,672.39
Analysis Overview
The Hang Seng Index (HSI) Elliott Wave Analysis for the daily chart presents a structured outlook on the index’s current trend and potential price movement based on Elliott Wave principles.
The market is in a bullish trend phase, characterized by impulsive price action rather than a corrective pullback. The primary wave structure under analysis is Orange Wave 1, positioned within Navy Blue Wave 3, defining its placement in the broader Elliott Wave framework.
Key Insights
- Orange Wave 1 of 3 is still in progress and appears to be approaching its final stages.
- This impulsive wave signals continued upward momentum before the formation of Orange Wave 2.
- Orange Wave 2 is expected to take shape following the completion of Orange Wave 1.
- The critical invalidation level is 18,672.39—a drop below this price point would invalidate the current wave count, potentially shifting the market outlook.
Trading Implications & Market Outlook
- Traders should closely track Orange Wave 1's completion, as it may signal the start of Orange Wave 2, presenting new trading opportunities.
- Analyzing the daily chart offers a long-term perspective, allowing traders to align their strategies with major market trends and key reversal points.
- A focus on wave structures and critical levels enhances entry and exit precision, optimizing trade decisions.
- Staying informed on evolving market conditions ensures traders can adjust their strategies to capitalize on potential price movements effectively.
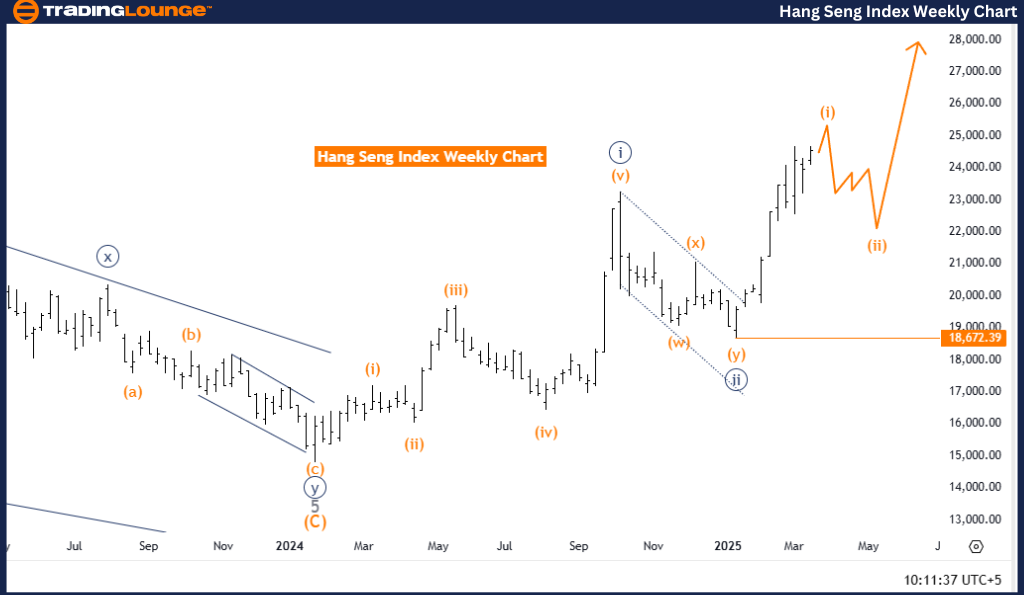
Hang Seng Index Elliott Wave Analysis – Trading Lounge Weekly Chart
Hang Seng Index Wave Technical Analysis
Function: Bullish Trend
Mode: Impulsive
Structure: Orange Wave 1
Position: Navy Blue Wave 3
Next Lower Degree Direction: Orange Wave 2
Wave Cancel Invalidation Level: 18,672.39
Analysis Overview
The Hang Seng Index (HSI) Elliott Wave Analysis for the weekly chart provides a comprehensive market outlook, highlighting key trends and potential price shifts based on Elliott Wave principles.
The market continues to exhibit a bullish trend phase, marked by impulsive price action rather than corrective pullbacks. The primary wave structure, Orange Wave 1, is positioned within Navy Blue Wave 3, further solidifying its place in the larger Elliott Wave cycle.
Key Insights
- Orange Wave 1 of 3 remains in progress and is nearing completion.
- This impulsive wave formation suggests strong directional momentum, reinforcing a potential continuation of the uptrend before Orange Wave 2 develops.
- The next wave to monitor is Orange Wave 2, expected to emerge following the completion of Orange Wave 1.
- The critical invalidation level is 18,672.39—a price drop below this level would invalidate the current wave count, indicating a possible market trend reversal.
Trading Implications & Market Outlook
- Monitoring Orange Wave 1’s completion is essential, as it may introduce new trading opportunities within Orange Wave 2.
- The weekly chart provides a long-term perspective, helping traders align their strategies with broader market movements and significant reversals.
- Focusing on wave structures and key price levels ensures optimized entry and exit decisions for traders.
- Traders who remain proactive and adaptable to market shifts can capitalize on price fluctuations effectively.
Technical Analyst: Malik Awais
Source: Visit Tradinglounge.com and learn from the Experts. Join TradingLounge Here
Previous: S&P 500 Elliott Wave Technical Analysis
VALUE Offer - Buy 1 Month & Get 3 Months!Click here
Access 7 Analysts Over 200 Markets Covered. Chat Room With Support