FTNT Elliott Wave Analysis – Trading Lounge Daily Chart
Fortinet Inc. (FTNT) – Elliott Wave Technical Outlook
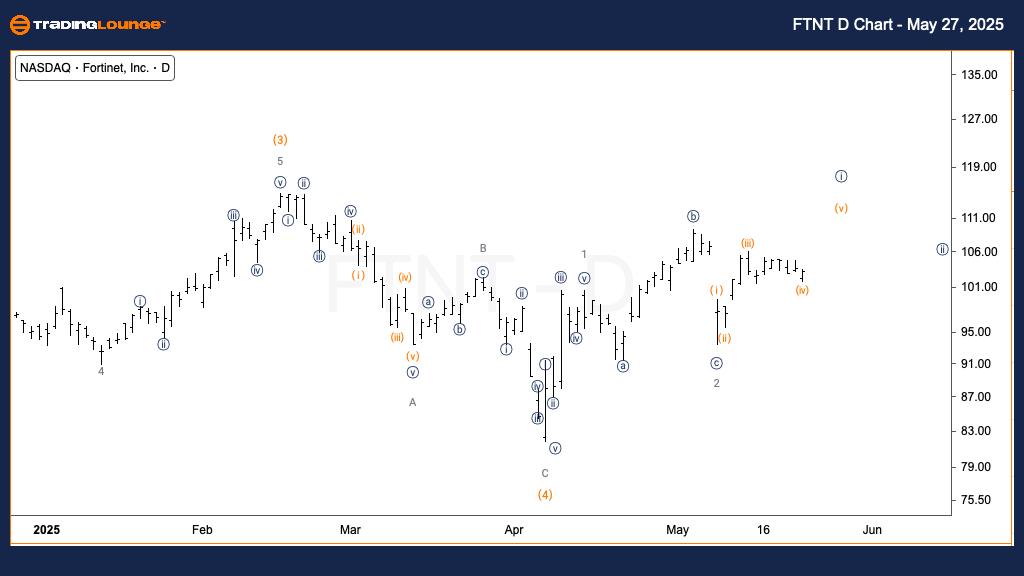
Daily Chart Overview
FUNCTION: Trend
MODE: Motive
STRUCTURE: Impulsive
POSITION: Wave {i} of 3
DIRECTION: Upside in {i}
DETAILS: Multiple 1-2 wave formations are forming. Sustained trading above the $100 mark indicates bullish strength in Intermediate wave (5).
Fortinet Inc. (NASDAQ: FTNT) displays a strong Elliott Wave impulse structure on its daily chart. The current technical setup points to wave {i} within wave 3, as part of the broader Intermediate wave (5). Persistent price action above the key $100 support level signals ongoing buyer interest, laying the groundwork for further upside movement. Holding above this threshold would likely confirm the beginning of a larger bullish wave sequence.
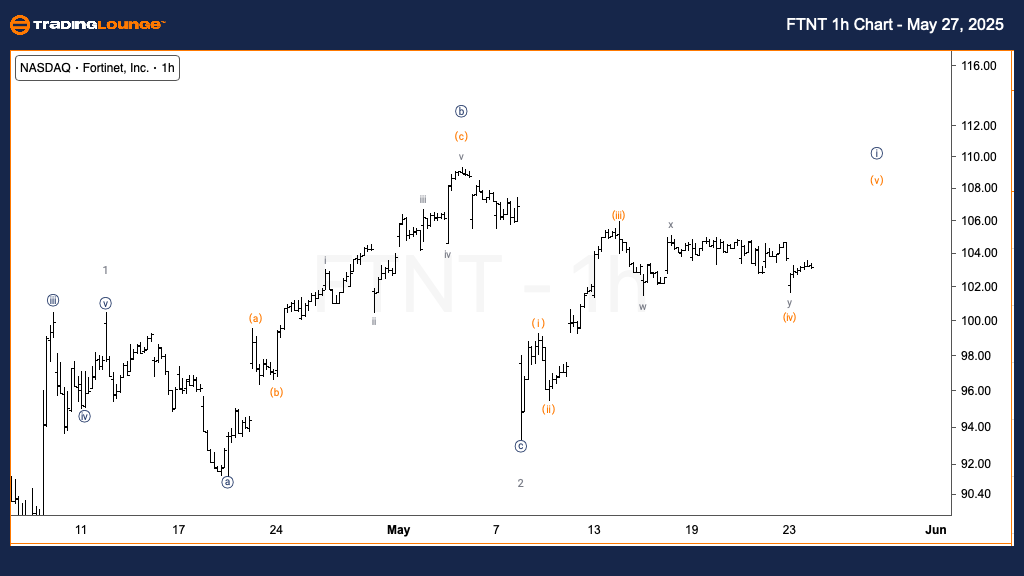
FTNT Elliott Wave Analysis – Trading Lounge 1-Hour Chart Overview
FUNCTION: Trend
MODE: Impulsive
STRUCTURE: Motive
POSITION: Wave (iv) of {i}
DIRECTION: Upside in wave (v)
DETAILS: Wave (v) is anticipated to advance further, finalizing the five-wave sequence of Minute wave {i}.
On the 1-hour timeframe, Fortinet stock appears to be consolidating within wave (iv), a setup that typically precedes another move higher into wave (v). The expected completion of this impulsive wave structure would mark the end of Minute wave {i}. Intraday traders and short-term investors should monitor for key resistance levels as wave (v) progresses.
Technical Analyst: Alessio Barretta
Source: Visit Tradinglounge.com and learn from the Experts. Join TradingLounge Here
Previous: Tesla Inc. (TSLA) Elliott Wave Technical Analysis
VALUE Offer - Buy 1 Month & Get 3 Months!Click here
Access 7 Analysts Over 200 Markets Covered. Chat Room With Support