27Jun

Elliott Wave Forecast for PayPal (PYPL) US Stock: Bullish Wave C Movement Across Daily and Hourly Charts Explained in Detail

PayPal Holdings Inc. (PYPL) Elliott Wave Forecast – Trading Lounge Daily Chart

PayPal Holdings Inc. (PYPL) Daily Chart Forecast

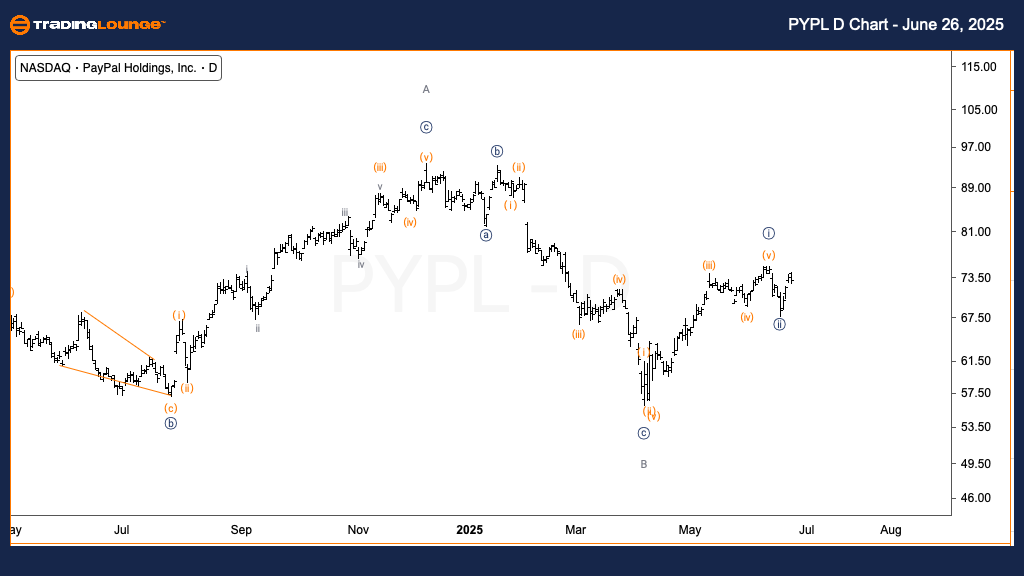
PayPal Holdings Inc. (PYPL) Elliott WaveTechnical Analysis

Function: Trend

Mode: Impulsive

Structure: Motive

Position: Wave C of (B)

Direction: Upside in Wave C

Details: The current Elliott Wave structure for PayPal (PYPL) suggests ongoing bullish momentum in Wave C. Pullbacks are unfolding in clear three-wave corrections, characteristic of continuation patterns within larger corrective phases, rather than indicating trend reversals. This supports a positive short-term outlook for the stock.

PYPL-Us-Stock-Day-Ch...


PayPal Holdings Inc. (PYPL) Elliott Wave Forecast – Trading Lounge 1-Hour Chart

Function: Trend

Mode: Impulsive

Structure: Motive

Position: Wave {iii} of C

Direction: Upside in Wave {iii}

Details: The 1-hour Elliott Wave chart for PYPL shows that Wave {ii} appears complete, with upward price movement initiating Wave {iii}. An alternative wave count could place this advance within Wave (v) of {i}, implying a minor consolidation before continued upside. Short-term bullish confirmation will rely on how price reacts near key resistance levels and whether momentum remains strong.

Technical Analyst: Alessio Barretta

Source: Visit Tradinglounge.com and learn from the Experts. Join TradingLounge Here 

Previous: Dell Technologies Inc. (DELL) Elliott Wave Technical Analysis

VALUE Offer - $1 for 2 Weeks then $29 a month!Click here

Access 7 Analysts Over 200 Markets Covered. Chat Room With Support

PYPL-Us-Stock-1h-Cha...


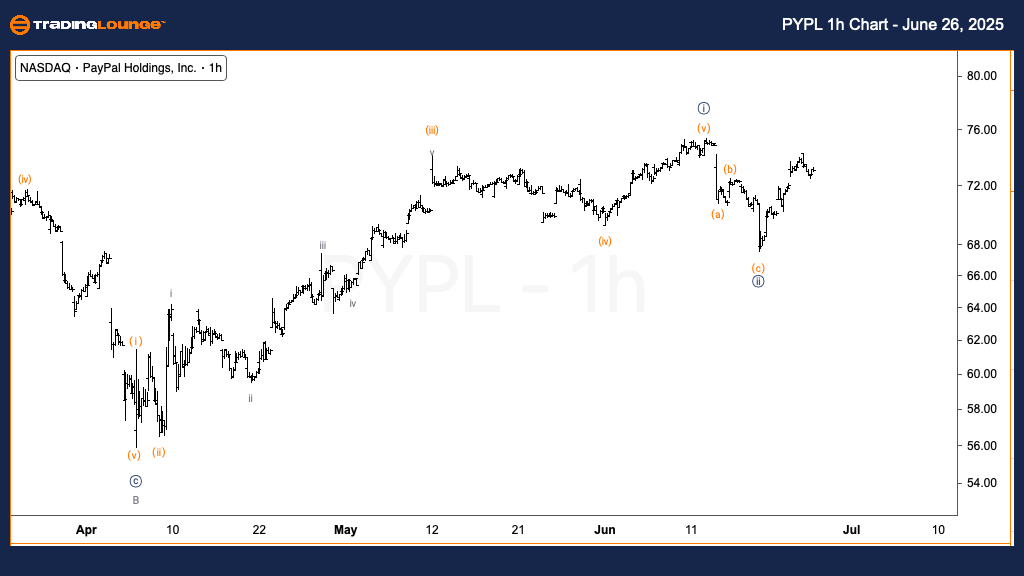
This comprehensive Elliott Wave analysis of PayPal Holdings Inc. (PYPL) integrates both daily and intraday timeframes to refine market perspective. The daily chart positions PYPL within Wave C of a larger corrective Wave (B), suggesting bullish potential. The 1-hour chart aligns this by identifying an impulsive move in Wave {iii}, or a possible extension in Wave (v), highlighting ongoing upward strength.

Related

Strategies for Forex Traders aiming to Capitalize on the EURUSD Market Trends: Euro/ U.S. Dollar Elliott Wave Technical Analysis

Strategies for Forex Traders aiming to Capitalize on the EURUSD Market Trends: Euro/ U.S. Dollar Elliott Wave Technical Analysis

This comprehensive analysis provides an in-depth look at the EURUSD using Elliott Wave Theory. Disco...

Read More >
URW Elliott Wave Analysis for ASX Stock Unibail Rodamco Westfield Provides Critical Insights into Potential Stock Price Movements

URW Elliott Wave Analysis for ASX Stock Unibail Rodamco Westfield Provides Critical Insights into Potential Stock Price Movements

Our latest Elliott Wave analysis for ASX UNIBAIL-RODAMCO-WESTFIELD (URW) provides critical insights ...

Read More >
New Zealand Dollar/ U.S. Dollar (NZDUSD) Elliott Wave Analysis: Bullish Trend Insights, and Market Outlook for Better Decisions

New Zealand Dollar/ U.S. Dollar (NZDUSD) Elliott Wave Analysis: Bullish Trend Insights, and Market Outlook for Better Decisions

NZDUSD Elliott Wave analysis covers the daily and 4-hour charts, focusing on bullish trends, wave co...

Read More >
Unlock ASX Trading Potential: REA GROUP LTD Stock Analysis & REA Elliott Wave Technical Forecast

Unlock ASX Trading Potential: REA GROUP LTD Stock Analysis & REA Elliott Wave Technical Forecast

Get the latest Elliott Wave analysis for ASX REA Group. Discover key stock trends, wave counts, and ...

Read More >
Bitcoin/U.S. dollar(BTCUSD) Elliott Wave Technical Analysis 23 October 23

Bitcoin/U.S. dollar(BTCUSD) Elliott Wave Technical Analysis 23 October 23

Bitcoin/U.S. dollar(BTCUSD) Elliott Wave Technical Analysis on 23 October 23 with BTCUSD Analysis Da...

Read More >
Corn Commodity Elliott Wave Technical Analysis: Market Outlook for Precise Trading Decisions

Corn Commodity Elliott Wave Technical Analysis: Market Outlook for Precise Trading Decisions

Corn futures continue to follow a bearish Elliott Wave pattern, with key resistance at 504.5 and pot...

Read More >

$1 for 2 Weeks

then $29 a month!

What a Special Offer!

Trade Recommendations

Unleash the power of deversified trading with our comprehensive portfolio, covering 250+ markets:

  • Stock Trades
  • Crypto Trades
  • Forex Trades
  • Commodity Trades
Elliott Wave Analysis

Gain a competitive edge with expert insights and AI-powered Elliott Wave charting into:

  • Global Indices
  • US Stocks & ASX Stocks
  • Forex & Crypto
  • Commodities
Top-Notch Trading Tools

Equip yourself with the tools of success:

  • Real-time Chat rooms
  • Elliott Wave Algorithm
  • Portfolio tools
  • TradingLevels
  • Screener
  • Trading Game
7 Elliott Wave Analysts

Stay ahead of the market with daily charts and insightful videos
Your secret to strategic trading!

JOIN HERE


Welcome to TradingLounge (ASIC A.R.No. 321187), specialists in trades, trading education and technical analysis, covering stocks, indices, commodities, forex and cryptocurrencies.

When you join TradingLounge you have access to everything we offer, including trade tools, educational content and a social platform to chat with like-minded investors.

Read more

@Copyright 2024 by tradinglounge.com

Contact Us

Australian no: 02 4787 6020

International no: +61 (2) 47876020

Pay with:

Find us on