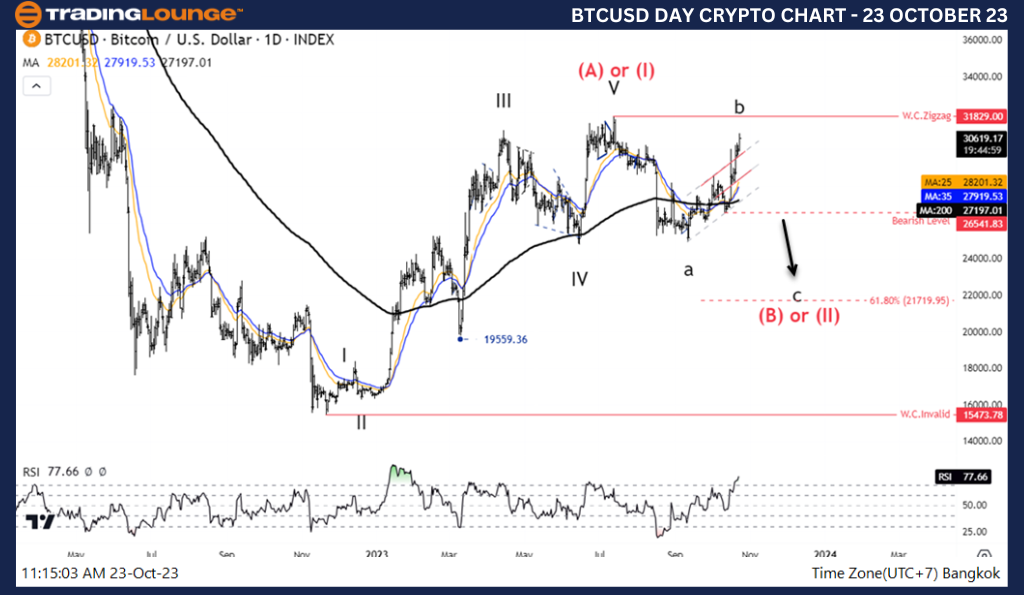
Elliott Wave Analysis TradingLounge Daily Chart, 23 October 23,
Bitcoin/U.S. dollar(BTCUSD)
BTCUSD Elliott Wave Technical Analysis
Function: Counter Trend
Mode: Corrective
Structure: Zigzag
Position: Wave((B))
Direction Next higher Degrees: wave (B) or (II)
Wave Cancel invalid level: 15473
Details: the increase of wave B before decline in wave C
Bitcoin/U.S. dollar(BTCUSD)Trading Strategy: Although we are seeing a good recovery for Bitcoin from the 26541 level, the price structure is a bearish rally. The three waves moving within the channel are corrective, giving us a bearish view of Bitcoin. watch out the increase above 31829 will break the Zigzag Pattern
Bitcoin/U.S. dollar(BTCUSD)Technical Indicators: The price is above the MA200 indicating an uptrend, RSI is a Bullish Momentum
TradingLounge Analyst: Kittiampon Somboonsod, CEWA
Source: Tradinglounge.com get trial here!
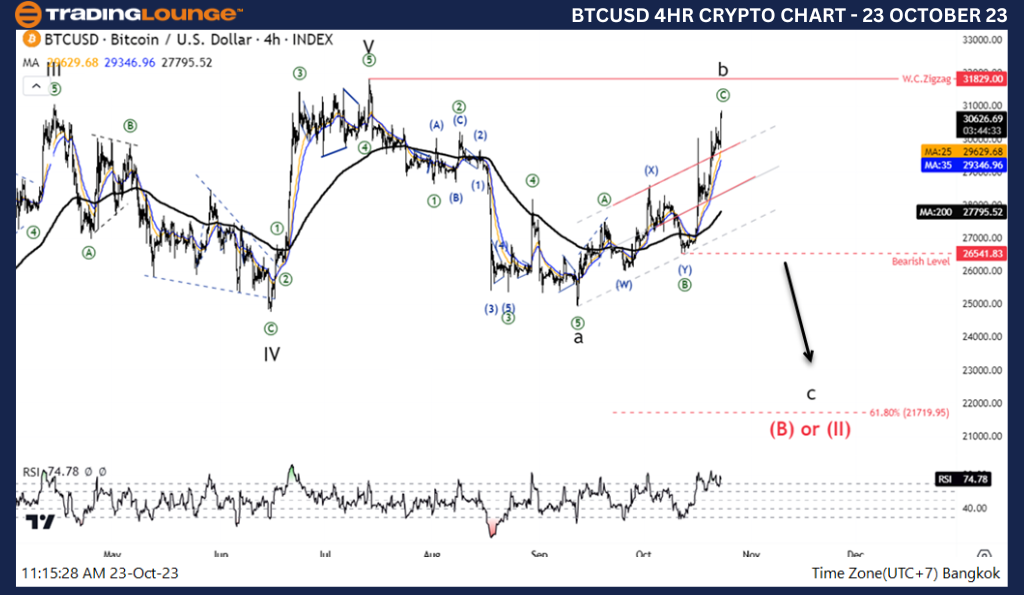
Elliott Wave Analysis TradingLounge 4H Chart, 23 October 23,
Bitcoin/U.S. dollar(BTCUSD)
BTCUSD Elliott Wave Technical Analysis
Function: Counter Trend
Mode: Corrective
Structure: Zigzag
Position: Wave((B))
Direction Next higher Degrees: wave (B) or (II)
Wave Cancel invalid level: 15473
Details: the increase of wave B before decline in wave C
Bitcoin/U.S. dollar(BTCUSD)Trading Strategy: Although we are seeing a good recovery for Bitcoin from the 26541 level, the price structure is a bearish rally. The three waves moving within the channel are corrective, giving us a bearish view of Bitcoin. watch out the increase above 31829 will break the Zigzag Pattern
Bitcoin/U.S. dollar(BTCUSD)Technical Indicators: The price is above the MA200 indicating an uptrend, RSI is a Bullish Momentum.