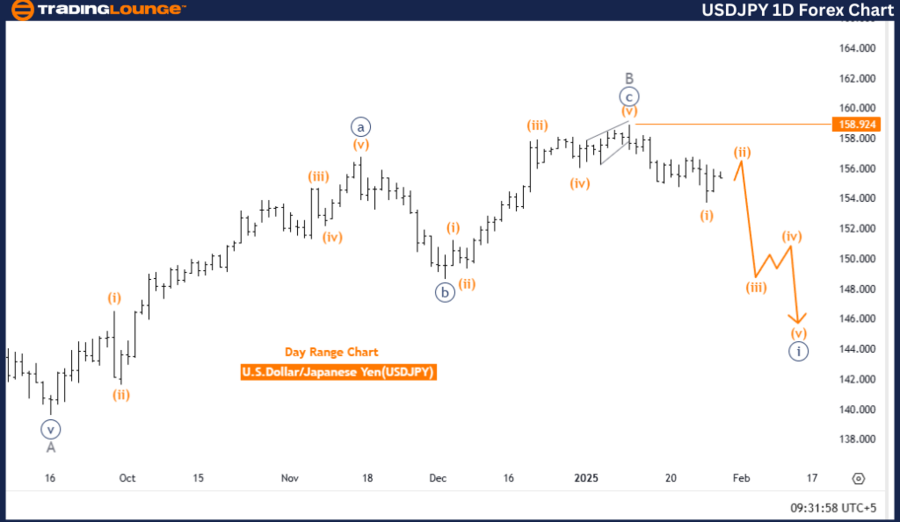
U.S. Dollar / Japanese Yen (USDJPY) Daily Chart Analysis
USDJPY Elliott Wave Technical Analysis
Function: Bearish Trend
Mode: Impulsive
Structure: Navy Blue Wave 1
Direction Next Lower Degrees: Navy Blue Wave 1 (Initiated)
Details: A new downward trend has begun with Navy Blue Wave 1.
Wave Cancel Invalidation Level: 158.924
Analysis Overview
This Elliott Wave analysis evaluates the USDJPY currency pair on the daily chart, identifying a bearish trend within an impulsive wave structure. The primary wave in focus, Navy Blue Wave 1, has recently started, marking the initial phase of a sustained downward trend.
The emergence of Navy Blue Wave 1 suggests that the market is in a strong bearish phase, indicating further downside potential. Given the impulsive nature of this wave, traders should closely monitor this movement, as it signifies the early stages of a broader bearish cycle.
Key Considerations
- The wave count invalidation level is set at 158.924.
- A break above this threshold would invalidate the current Elliott Wave count, necessitating a market outlook reassessment.
- The impulsive nature of Navy Blue Wave 1 reinforces the bearish trend, indicating sustained selling pressure.
Conclusion
The daily Elliott Wave analysis for USDJPY confirms a bearish trend initiation, driven by Navy Blue Wave 1. Its impulsive wave characteristics indicate potential continued downside movement.
The invalidation level at 158.924 is crucial for risk management, serving as a reference for confirming or rejecting the wave count.
This technical analysis provides valuable market insights, helping traders align their strategies with the developing bearish trend while staying cautious of possible market reversals.
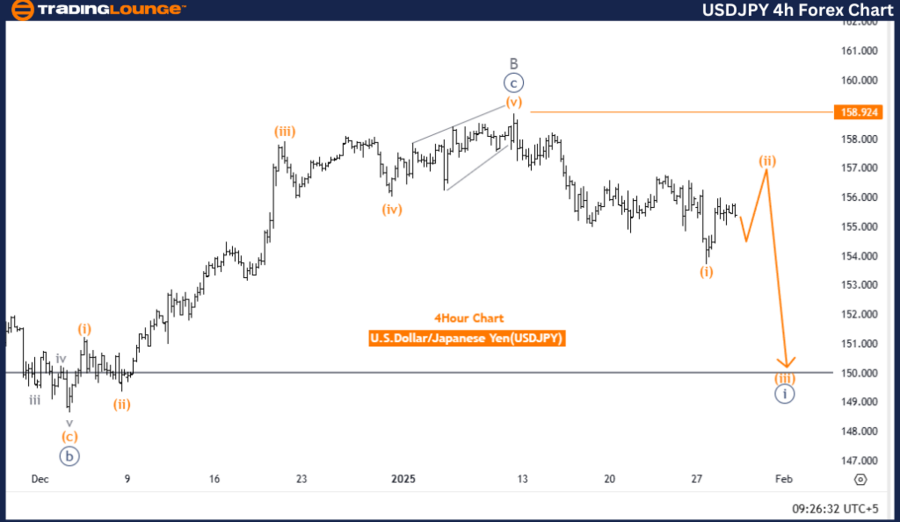
U.S. Dollar / Japanese Yen (USDJPY) 4-Hour Chart Analysis
USDJPY Elliott Wave Technical Analysis
Function: Counter Trend
Mode: Corrective
Structure: Orange Wave 2
Position: Navy Blue Wave 1
Direction Next Lower Degrees: Orange Wave 3
Details: Orange Wave 1 of Navy Blue Wave 1 appears completed, with Orange Wave 2 currently developing.
Wave Cancel Invalidation Level: 158.924
Analysis Overview
This analysis examines the USDJPY currency pair on the 4-hour chart, highlighting a counter-trend correction in a corrective wave structure. The current phase under observation is Orange Wave 2, which follows the completion of Orange Wave 1 within Navy Blue Wave 1. This development suggests a temporary market pullback before a potential continuation of the primary trend.
Currently, the pair is positioned within Navy Blue Wave 1, with Orange Wave 2 unfolding. This phase represents a corrective retracement, allowing for market consolidation before the next impulse wave.
Following the completion of Orange Wave 2, the emergence of Orange Wave 3 is anticipated, which may resume bullish momentum.
Key Considerations
- The invalidation level for this wave count is set at 158.924.
- A decline below this level would invalidate the current structure, necessitating a revised market analysis.
- The anticipated formation of Orange Wave 3 may signal a return to bullish momentum after the corrective phase.
Conclusion
The 4-hour Elliott Wave analysis of USDJPY indicates a corrective counter-trend phase, marked by the formation of Orange Wave 2 within Navy Blue Wave 1. The conclusion of Orange Wave 1 signals the start of this short-term pullback, with Orange Wave 3 likely to follow.
The 158.924 invalidation level acts as a critical risk management tool, helping traders confirm or invalidate the current Elliott Wave structure.
This Elliott Wave technical analysis offers structured insights into the ongoing market correction, equipping traders with the necessary tools to navigate price movements effectively and prepare for possible trend shifts within the Elliott Wave framework.
Technical Analyst: Malik Awais
Source: visit Tradinglounge.com and learn From the Experts Join TradingLounge Here
Previous: USDCHF Elliott Wave Technical Analysis
VALUE Offer - Buy 1 Month & Get 3 Months!Click here
Access 7 Analysts Over 200 Markets Covered. Chat Room With Support