Deciphering Natural Gas Prices: An Elliott Wave Market Analysis

Natural Gas Elliott wave Technical Analysis

Mode - Impulsive 

Structure - Impulse Wave 

Position - Wave (iii) of 5

Direction - Wave (iii) of 5 still in play

Details:  Price now in wave iii as it attempts to breach 1.65 wave i low. Wave (iii) is still expected to extend lower in an impulse.

Natural Gas is currently breaching the previous April low, marking a decisive move as the impulse initiated on 5th March continues its downward trajectory, further extending the overarching impulse wave sequence that commenced back in August 2022. This decline is anticipated to persist as long as the price remains below the critical resistance level of 2.012.

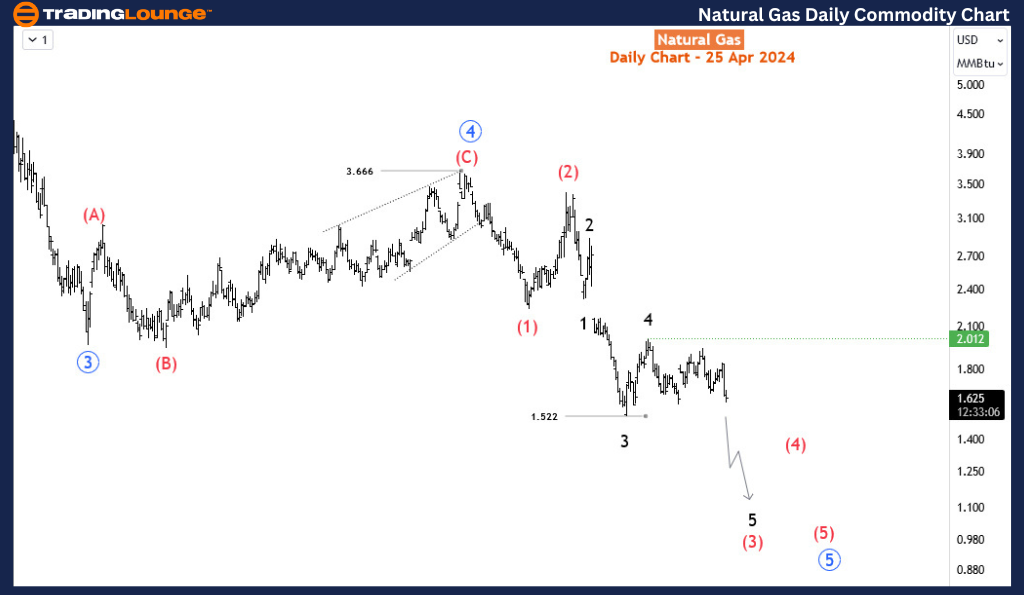
Expert Predictions and Trading Insights with Daily Chart Analysis

Zooming in on the daily chart, we observe the medium-term impulse wave originating from August 2022, which is persisting in its downward trend after completing its 4th wave - delineated as primary wave 4 in blue (circled) - at 3.666 in October 2023. Presently, the 5th wave, identified as primary blue wave 5, is underway, manifesting as an impulse at the intermediate degree in red. It is envisaged that the price will breach the February 2024 low of 1.533 as wave 5 of (3) seeks culmination before an anticipated rebound in wave (4). This confluence of price movements underscores the bearish sentiment prevailing over Natural Gas in the medium term.
Natural-Gas-Commodit...


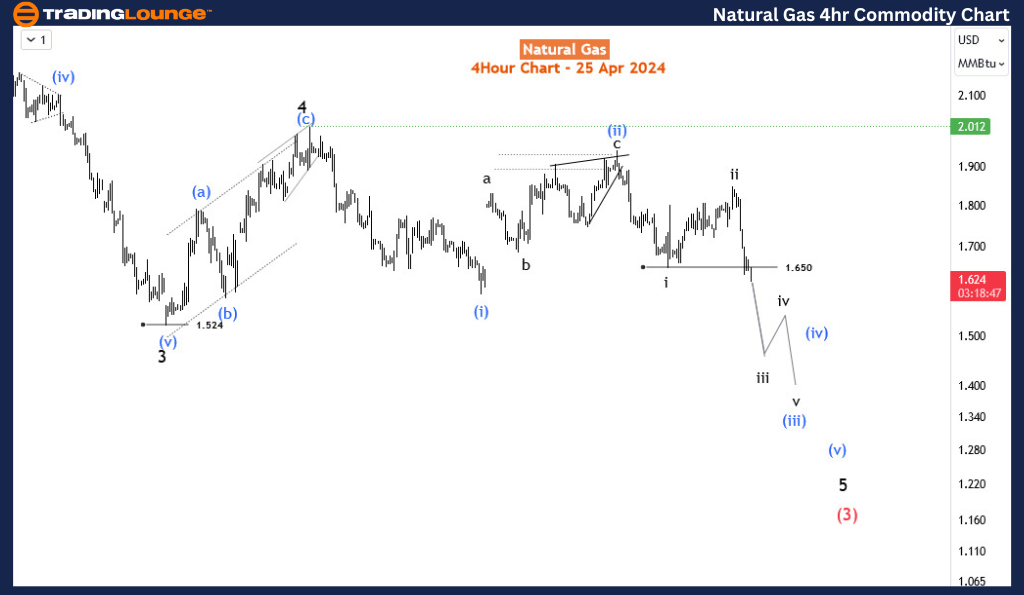
Elliott Wave Technical Forecast for Natural Gas 4-hour Chart Analysis

Analyzing the H4 chart, we initiated the impulse wave count for wave (3) from the level of 2.012, which marks the termination point of wave 4. Notably, price action formed a 1-2-1-2 structure, with confirmation established at 1.65 and invalidation set at 2.012. The confirmation of our anticipated direction materialized as price breached the 1.65 mark, signifying a resumption of bearish momentum. Presently, there appears to be minimal resistance hindering the bears, thereby reinstating their dominance in the market. It is projected that wave iii of (iii) of 5 will manifest around 1.43, indicative of the potential for the wave 5 low to extend to 1.3 or even lower. This comprehensive analysis underscores the prevailing bearish outlook for Natural Gas in the immediate future.

Technical Analyst: Sanmi Adeagbo

Source: visit Tradinglounge.com and learn From the Experts Join TradingLounge Here 

See Previous: Gold Elliott Wave Analysis 

Special Trial Offer - 0.76 Cents a Day for 3 Months!  Click here
Access 6 Analysts covering over 150 Markets. Chat Room With Support
Natural-Gas-Commodit...

Related

New Zealand Dollar/U.S.DollarCurrency Pair: NZDUSD Forex Elliott Wave Technical Analysis

New Zealand Dollar/U.S.DollarCurrency Pair: NZDUSD Forex Elliott Wave Technical Analysis

Explore our comprehensive NZDUSD Elliott Wave analysis, including detailed day and 4-hour chart revi...

Read More >
Grasim Industries Stocks Elliott Wave Technical Analysis: Insights & Price Targets with Daily and 4H Chart Breakdowns

Grasim Industries Stocks Elliott Wave Technical Analysis: Insights & Price Targets with Daily and 4H Chart Breakdowns

Grasim Industries' Elliott Wave analysis reveals key technical patterns and stock predictions. E...

Read More >
Visa Inc. (V) Elliott Wave Technical Analysis: Daily and 4Hr Chart Insights 8 February 24

Visa Inc. (V) Elliott Wave Technical Analysis: Daily and 4Hr Chart Insights 8 February 24

Delve into the intricate world of Visa Inc. (V) with our expert Elliott Wave analysis dated 8 Februa...

Read More >
Wheat Commodities: Comprehensive expert  Elliott Wave Technical Analysis of the Wheat Market

Wheat Commodities: Comprehensive expert Elliott Wave Technical Analysis of the Wheat Market

This comprehensive guide provides an expert Elliott Wave Analysis of the Wheat Market for 2024, high...

Read More >
U.S. Dollar / Swiss Franc Forex Currency Pair is Currently in a Corrective Phase - USDCHF Elliott Wave Technical Analysis

U.S. Dollar / Swiss Franc Forex Currency Pair is Currently in a Corrective Phase - USDCHF Elliott Wave Technical Analysis

According to Elliott Wave analysis, the USDCHF is currently in a corrective phase. Orange Wave 2 is ...

Read More >
NEO Crypto Price: Key Technical Indicators to enhance your trading decisions: NEOUSD Elliott Wave Technical Analysis

NEO Crypto Price: Key Technical Indicators to enhance your trading decisions: NEOUSD Elliott Wave Technical Analysis

Explore comprehensive Elliott Wave analysis for NEO/USD, including daily and H4 chart insights, corr...

Read More >

Buy 1 Month

Get 3 Months!

Special Offer:

Trade Recommendations

Unleash the power of deversified trading with our comprehensive portfolio, covering:

  • Stock Trades
  • Crypto Trades
  • Forex Trades
  • Commodity Trades
Elliott Wave Analysis

Gain a competive edge with expert insights in to:

  • Global Indices
  • US Stocks & ASX Stocks
  • Forex & Crypto
  • Commodities
Top-Notch Trading Tools

Equip yourself with the tools of success:

  • Social Chat
  • Elliott Wave Algorithm
  • Screener
  • TradingLevels
  • Trading Game
7 Elliott Wave Analysts

Stay ahead of the market with daily charts and insightful videos
-Your secret to strategic trading!

JOIN HERE


Welcome to TradingLounge (ASIC A.R.No. 321187), specialists in trades, trading education and technical analysis, covering stocks, indices, commodities, forex and cryptocurrencies.

When you join TradingLounge you have access to everything we offer, including trade tools, educational content and a social platform to chat with like-minded investors.

Read more

@Copyright 2024 by tradinglounge.com

Contact Us

Australian no: 02 4787 6020

International no: +61 (2) 47876020

Pay with:

Find us on