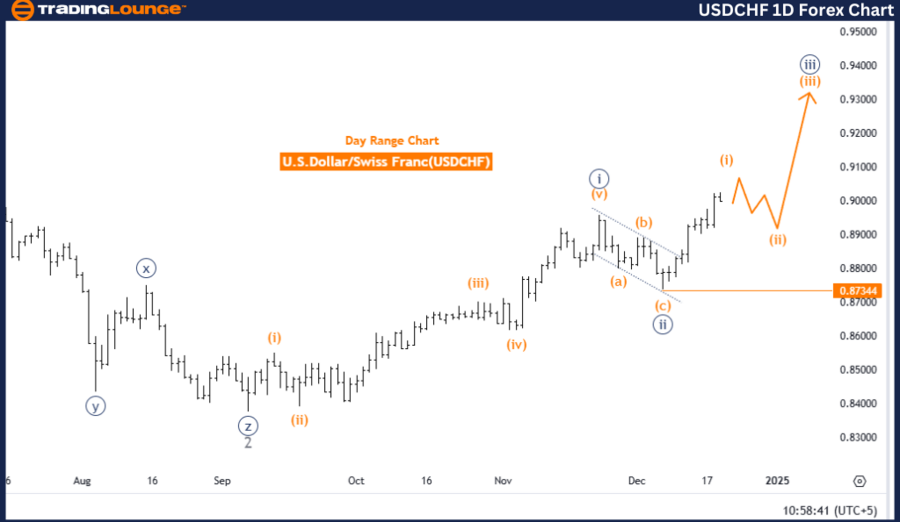
U.S. Dollar / Swiss Franc (USDCHF) - TradingLounge Day Chart

USDCHF Elliott Wave Technical Analysis

Function: Bullish Trend

Mode: Impulsive

Structure: Orange wave 1

Position: Navy Blue Wave 3

Direction Next Lower Degrees: Orange wave 2

Details: Orange wave C of 2 is complete. Orange wave 1 of navy blue wave 3 is in progress.

Wave Cancel Invalidation Level: 0.87344

USDCHF Analysis Summary

The USDCHF daily chart highlights a bullish trajectory, analyzed through the lens of Elliott Wave theory. The market is progressing through an impulsive wave pattern, specifically focusing on orange wave 1, which is part of the larger navy blue wave 3. This structure supports sustained upward movement, aligning with the prevailing market direction.

Details of Wave Progression

  • The completion of orange wave C signifies the conclusion of the corrective phase within orange wave 2.

  • Subsequently, the initiation of orange wave 1 within navy blue wave 3 indicates a transition into an impulsive upward phase.
  • This movement underscores a shift from consolidation to trend-following dynamics.

Next Phase Outlook

  • The anticipated next lower degree movement is orange wave 2, which is expected to briefly interrupt the upward trajectory.

  • Despite this, orange wave 2 is likely to establish a foundation for the continuation of navy blue wave 3 as the bullish trend resumes.

Critical Threshold

  • The wave cancel invalidation level is defined at 0.87344. A breach below this level would nullify the current wave count, requiring a reassessment of the market structure.

Conclusion

In conclusion, the USDCHF daily chart suggests a robust bullish trend. The completion of orange wave C and the progression of orange wave 1 within navy blue wave 3 emphasize ongoing upward momentum. Orange wave 2, anticipated as a corrective phase, is expected to consolidate this movement before the bullish trend resumes. This analysis aligns with Elliott Wave principles, providing insights into the structural dynamics driving USDCHF's market behavior.

USDCHF-1d-forex-char...


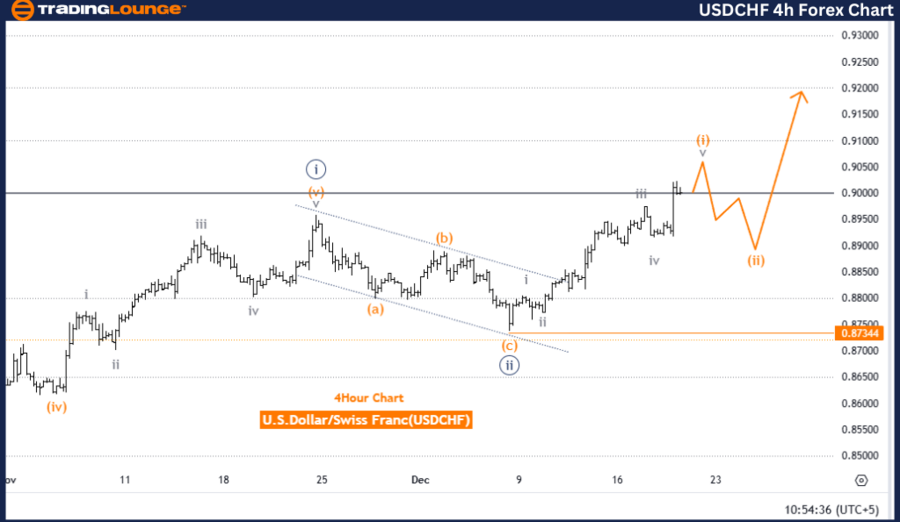
U.S. Dollar / Swiss Franc (USDCHF) - TradingLounge 4-Hour Chart

USDCHF Elliott Wave Technical Analysis

Function: Bullish Trend

Mode: Impulsive

Structure: Orange wave 1

Position: Navy blue wave 3

Direction Next Lower Degrees: Orange wave 2

Details: Orange wave C of 2 is complete. Orange wave 1 of navy blue wave 3 is in progress.

Wave Cancel Invalidation Level: 0.87344

U.S. Dollar / Swiss Franc Analysis Overview

The USDCHF 4-hour chart confirms a bullish trend through the Elliott Wave framework. The observed structure is orange wave 1, an impulsive wave pattern indicating strong upward momentum. Positioned within navy blue wave 3, this movement is consistent with the continuation of a broader bullish trend.

Wave Progression Details

  • The completion of orange wave C of wave 2 signals the end of the corrective phase.

  • The subsequent development of orange wave 1 within navy blue wave 3 marks the start of a new impulsive upward trend, transitioning from a consolidation phase.

Outlook for Next Lower Degree Movement

  • The next expected movement is orange wave 2, a corrective wave that may temporarily disrupt the upward trend.

  • Nevertheless, orange wave 2 is anticipated to solidify the groundwork for the continuation of navy blue wave 3, aligning with the broader bullish outlook.

Key Market Dynamics

This analysis highlights the cyclical nature of market behavior:

  • Corrective waves, such as orange wave C, set the stage for impulsive waves like orange wave 1.
  • These transitions illustrate the market's adherence to dominant bullish momentum.

Conclusion

The USDCHF 4-hour chart reinforces the bullish outlook. The completion of orange wave C and the active development of orange wave 1 within navy blue wave 3 demonstrate ongoing upward momentum. The anticipated orange wave 2 is likely to play a pivotal role in shaping subsequent bullish phases.

The wave cancel invalidation level, set at 0.87344, serves as a key threshold for confirming or revising this analysis. This wave structure aligns with Elliott Wave principles, supporting the continued bullish momentum in the USDCHF market.

Technical Analyst: Malik Awais

Source: visit Tradinglounge.com and learn From the Experts Join TradingLounge Here 

Previous: Euro/U.S. Dollar (EURUSD) Elliott Wave Technical Analysis

VALUE Offer - Buy 1 Month & Get 3 Months!Click here

Access 7 Analysts Over 200 Markets Covered. Chat Room With Support

USDCHF-4h-forex-char...

Related

Ethereum/ U.S. dollar(ETHUSD) Elliott Wave Technical Analysis 9 November 23

Ethereum/ U.S. dollar(ETHUSD) Elliott Wave Technical Analysis 9 November 23

Ethereum/ U.S. dollar(ETHUSD) Elliott Wave Technical Analysis 9 November 23 indicating an uptrend an...

Read More >
DAX 40 (Germany) Index Elliott Wave Technical Analysis - Learn how to trade DAX 40, Track Bullish and Bearish Signals

DAX 40 (Germany) Index Elliott Wave Technical Analysis - Learn how to trade DAX 40, Track Bullish and Bearish Signals

This article provides a complete DAX 40 trading analysis, utilizing Elliott Wave theory to predict m...

Read More >
Elliott Wave Technical Analysis of AAVE/USD: Navigating the Wave Patterns for Strategic Trading

Elliott Wave Technical Analysis of AAVE/USD: Navigating the Wave Patterns for Strategic Trading

This article provides an in-depth Elliott Wave Analysis of the AAVE/USD cryptocurrency pair, offerin...

Read More >
Polkadot Price Prediction and Elliott Wave Analysis: Get Insights on DOTUSD Trends, Trading Strategies and Bullish Momentum

Polkadot Price Prediction and Elliott Wave Analysis: Get Insights on DOTUSD Trends, Trading Strategies and Bullish Momentum

Stay ahead in the cryptocurrency market with this comprehensive analysis of Polkadot (DOTUSD). Disco...

Read More >
USDJPY Elliott Wave Analysis: Strong Bearish Trend, Orange Wave 3 Setups, Trading Strategies, and Daily/4H Chart Forecast

USDJPY Elliott Wave Analysis: Strong Bearish Trend, Orange Wave 3 Setups, Trading Strategies, and Daily/4H Chart Forecast

Detailed USDJPY Elliott Wave analysis highlighting a strong bearish trend and trading opportunities ...

Read More >
Commodities: Rising Trends in USD DXY, 10-Year Yields, and Future Upside for Bitcoin, Gold and Silver

Commodities: Rising Trends in USD DXY, 10-Year Yields, and Future Upside for Bitcoin, Gold and Silver

The latest commodity market analysis, employing Elliott Wave Theory, indicates a nearing completion ...

Read More >

$1 for 2 Weeks

then $29 a month!

What a Special Offer!

Trade Recommendations

Unleash the power of deversified trading with our comprehensive portfolio, covering 250+ markets:

  • Stock Trades
  • Crypto Trades
  • Forex Trades
  • Commodity Trades
Elliott Wave Analysis

Gain a competitive edge with expert insights and AI-powered Elliott Wave charting into:

  • Global Indices
  • US Stocks & ASX Stocks
  • Forex & Crypto
  • Commodities
Top-Notch Trading Tools

Equip yourself with the tools of success:

  • Real-time Chat rooms
  • Elliott Wave Algorithm
  • Portfolio tools
  • TradingLevels
  • Screener
  • Trading Game
7 Elliott Wave Analysts

Stay ahead of the market with daily charts and insightful videos
Your secret to strategic trading!

JOIN HERE


Welcome to TradingLounge (ASIC A.R.No. 321187), specialists in trades, trading education and technical analysis, covering stocks, indices, commodities, forex and cryptocurrencies.

When you join TradingLounge you have access to everything we offer, including trade tools, educational content and a social platform to chat with like-minded investors.

Read more

@Copyright 2024 by tradinglounge.com

Contact Us

Australian no: 02 4787 6020

International no: +61 (2) 47876020

Pay with:

Find us on