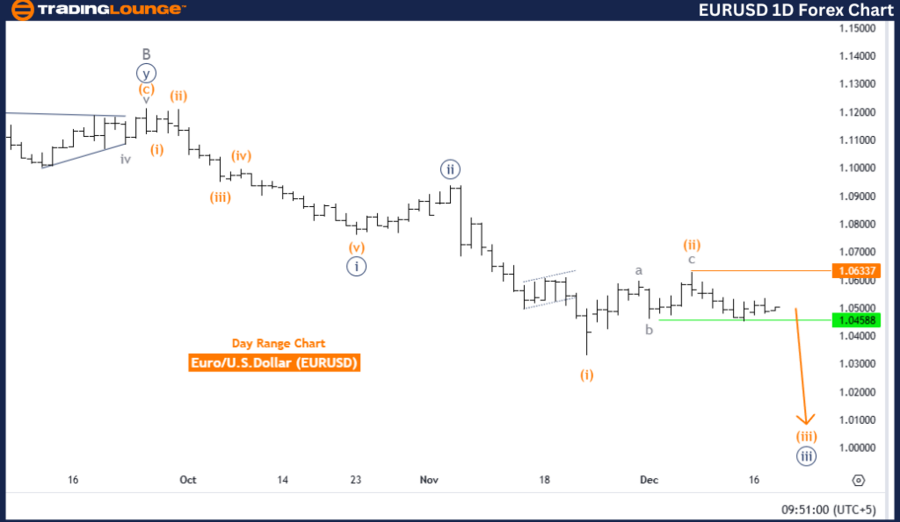
EURUSD Elliott Wave Analysis - Trading Lounge Daily Chart
Euro/U.S. Dollar (EURUSD) Daily Chart Analysis
EURUSD Elliott Wave Technical Analysis
Function: Bearish Trend
Mode: Impulsive
Structure: Orange Wave 3
Position: Navy Blue Wave 3
Next Lower Degree Direction: Orange Wave 3 (Initiated)
Key Details:
- Orange Wave 2 has been completed.
- Currently, Orange Wave 3 of Navy Blue Wave 3 is in progress.
Wave Cancel Invalid Level: 1.06337
The EURUSD daily chart reflects a strong bearish trend based on Elliott Wave principles. The wave structure demonstrates an impulsive behavior, showcasing significant downward momentum.
Key highlights:
- Completion of Orange Wave 2: This marks the end of the corrective phase.
- Development of Orange Wave 3: Now unfolding as part of the larger Navy Blue Wave 3, it exhibits intensified bearish momentum.
- Reinforcement of Bearish Forces: The wave alignment confirms a bearish outlook at both intermediate and higher degrees, indicating continued declines.
The invalidation level is set at 1.06337, a critical benchmark for risk management. A move above this level would negate the current wave count and require a reassessment of the bearish scenario.
Summary
- Orange Wave 2 has concluded.
- Orange Wave 3 is actively progressing within Navy Blue Wave 3.
- Impulsive wave structures highlight sustained downward momentum.
Invalidation Level: 1.06337 – traders should monitor this threshold to validate or reassess the bearish outlook.
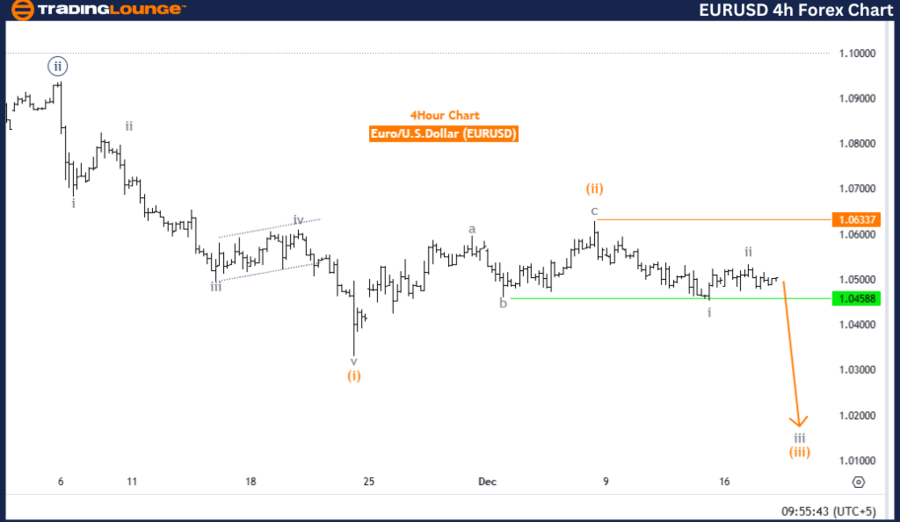
Euro/U.S. Dollar (EURUSD) 4-Hour Chart Tradinglounge
EURUSD Elliott Wave Technical Analysis
Function: Bearish Trend
Mode: Impulsive
Structure: Gray Wave 3
Position: Orange Wave 3
Next Lower Degree Direction: Gray Wave 3 (Initiated)
Key Details:
- Gray Wave 2 is complete.
- Gray Wave 3 is currently developing.
Wave Cancel Invalid Level: 1.06337
The EURUSD 4-hour chart also confirms a bearish trend under the Elliott Wave framework. The impulsive nature of the wave structure underscores robust downward market momentum.
Key highlights:
- Completion of Gray Wave 2: Marks the conclusion of a corrective phase.
- Progression of Gray Wave 3: Signals dominant bearish sentiment, with strong downward movement.
- Bearish Market Alignment: Gray Wave 3, part of Orange Wave 3, aligns with continued bearish dynamics, indicating no immediate reversal.
The invalidation level remains at 1.06337, a pivotal point for managing risk. If breached, it will necessitate a reassessment of the current Elliott Wave count.
Summary
- Gray Wave 2 has concluded.
- Gray Wave 3 is actively unfolding, reflecting sustained bearish momentum.
- Traders should maintain a bearish bias while keeping an eye on the invalidation level at 1.06337 to evaluate any potential changes in market trends.
Technical Analyst: Malik Awais
Source: visit Tradinglounge.com and learn From the Experts Join TradingLounge Here
Previous: AUDUSD Elliott Wave Technical Analysis
VALUE Offer - Buy 1 Month & Get 3 Months!Click here
Access 7 Analysts Over 200 Markets Covered. Chat Room With Support