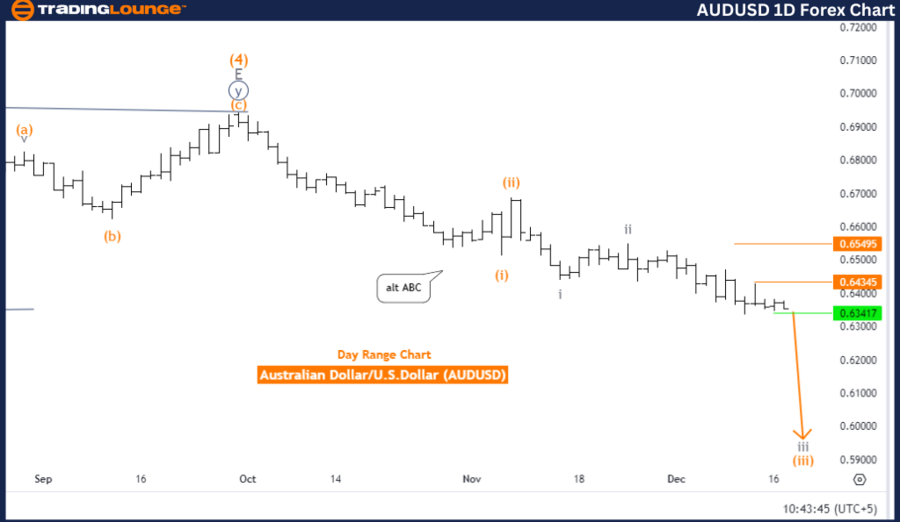
Australian Dollar/U.S. Dollar (AUDUSD) Day Chart
AUDUSD Elliott Wave Technical Analysis
Function: Bearish Trend
Mode: Impulsive
Structure: Gray Wave 3
Position: Orange Wave 3
Direction Next Higher Degrees: Gray Wave 4
Details: Gray wave 2 appears complete; gray wave 3 is currently in play.
Wave Cancel Invalidation Level: 0.64345
The AUDUSD day chart reflects a strong bearish trend under Elliott Wave analysis. The market remains in an impulsive phase, with gray wave 3 actively progressing. This structure highlights significant downward momentum as part of a larger bearish movement.
Gray wave 2 has already concluded, signaling the end of the preceding corrective phase. Currently, the market is advancing through gray wave 3, known for its intensity and extended nature within the Elliott Wave cycle. This phase aligns with the dominant bearish sentiment and reinforces further price declines.
At a more minor degree, the market sits within orange wave 3, which develops inside the larger gray wave 3 structure. Orange wave 3 strengthens the ongoing bearish trend, providing further confirmation of the impulsive phase.
Outlook
The higher-degree focus points to gray wave 4, expected to initiate a corrective rebound following the completion of gray wave 3. For now, the emphasis remains on the downward continuation of gray wave 3 and orange wave 3, which are driving the bearish movement.
Critical Invalidation Level
The wave count becomes invalid if the price exceeds 0.64345. Surpassing this level would require a reassessment of the wave structure. Traders should use this point as a key marker for risk management and spotting potential trend reversals.
Summary
The AUDUSD day chart highlights a persistent bearish trend led by gray wave 3 and orange wave 3. With gray wave 2 complete and impulsive momentum continuing downward, further price declines are anticipated. Traders should maintain a bearish outlook while closely monitoring the invalidation level at 0.64345.
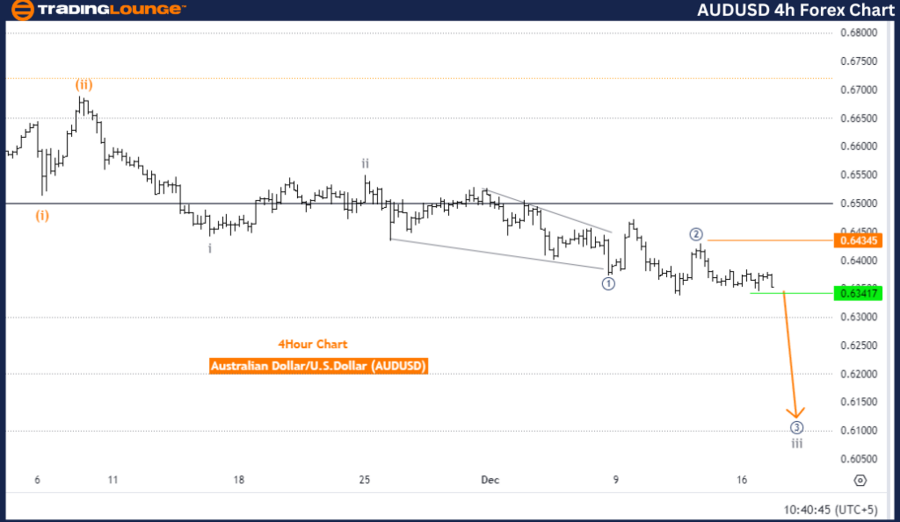
Australian Dollar/U.S. Dollar (AUDUSD) 4-Hour Chart
AUDUSD Elliott Wave Technical Analysis
Function: Bearish Trend
Mode: Impulsive
Structure: Micro Navy Blue Wave 3
Position: Gray Wave 3
Direction Next Higher Degrees: Gray Wave 4
Details: Micro navy blue wave 2 appears completed; micro navy blue wave 3 is currently in play.
Wave Cancel Invalidation Level: 0.64345
The AUDUSD 4-hour chart analysis confirms a sustained bearish trend under Elliott Wave theory. The market remains in an impulsive phase, with micro navy blue wave 3 advancing downward. This wave operates within the larger gray wave 3, reflecting the dominant bearish momentum.
The completion of micro navy blue wave 2 indicates the end of a minor corrective phase. Now, the market has transitioned into micro navy blue wave 3, a phase typically characterized by sharp and extended downward movements. This dynamic wave suggests further short-term price weakness.
Higher Degree Outlook
The next phase in the higher cycle, gray wave 4, will likely introduce a corrective rebound after gray wave 3 concludes. Until then, the focus remains on the bearish trajectory of micro navy blue wave 3, which continues to push the market lower.
Critical Invalidation Level
The wave count is invalid if the price rises above 0.64345. This level is critical for managing risk and identifying potential reversals in trend direction. Any movement beyond this threshold requires a reevaluation of the market structure.
Summary
The AUDUSD 4-hour chart signals a clear bearish trend, driven by micro navy blue wave 3. The conclusion of wave 2 and the ongoing impulsive phase reinforce market weakness. Traders should align strategies with the bearish outlook, while monitoring the invalidation level at 0.64345 to manage risk effectively.
Technical Analyst: Malik Awais
Source: visit Tradinglounge.com and learn From the Experts Join TradingLounge Here
Previous: GBPUSD Elliott Wave Technical Analysis
VALUE Offer - Buy 1 Month & Get 3 Months!Click here
Access 7 Analysts Over 200 Markets Covered. Chat Room With Support