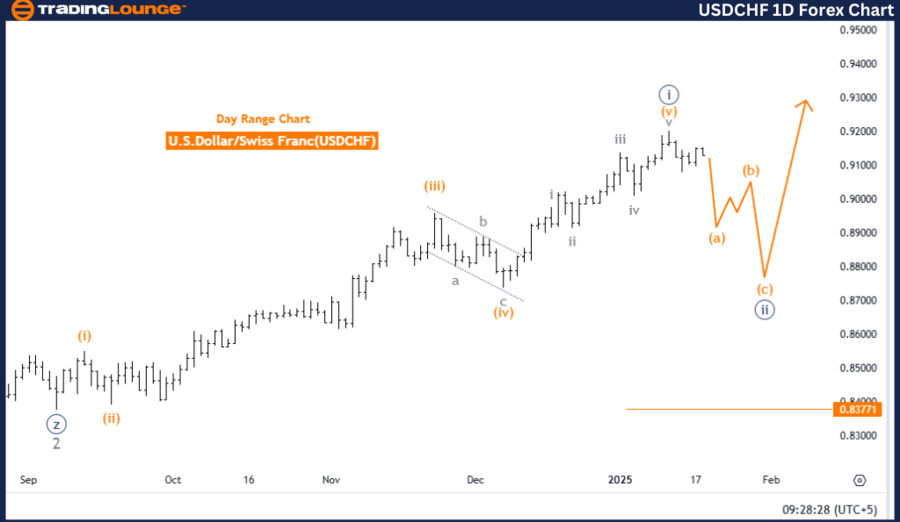
U.S. Dollar / Swiss Franc (USDCHF) Elliott Wave Analysis – Daily Chart
USDCHF Elliott Wave Technical Analysis
Function: Counter Trend
Mode: Corrective
Structure: Navy Blue Wave 2
Position: Gray Wave 3
Next Higher Degree Direction: Navy Blue Wave 3
Details: Navy Blue Wave 1 has completed, with Navy Blue Wave 2 currently forming.
Wave Invalidation Level: 0.83771
The USDCHF daily chart indicates an ongoing corrective wave phase within the Elliott Wave framework, identifying a counter-trend movement. The analysis suggests that the completion of navy blue wave one has led to the formation of navy blue wave two, representing a temporary retracement within the broader market trend.
Currently, the market structure places navy blue wave two within gray wave three, reflecting an ongoing corrective sequence. This phase is crucial in preparing for the anticipated transition into navy blue wave three, which could signal a continuation of the upward momentum.
The invalidation level of 0.83771 serves as a critical reference point; any price movement below this level would invalidate the current Elliott Wave count and necessitate a re-evaluation. Maintaining price action above this threshold supports the continuation of the corrective structure.
This phase indicates a typical retracement or consolidation period, which often precedes an upward trend continuation in navy blue wave three. Traders should closely monitor wave progression to identify potential trend shifts.
Conclusion
The USDCHF daily chart highlights an ongoing counter-trend correction, with navy blue wave two developing after the completion of navy blue wave one. The corrective structure is positioned within gray wave three. The key invalidation level of 0.83771 must hold for the current wave count to remain valid. As the market progresses, the anticipated transition to navy blue wave three could present bullish opportunities in alignment with the broader trend.
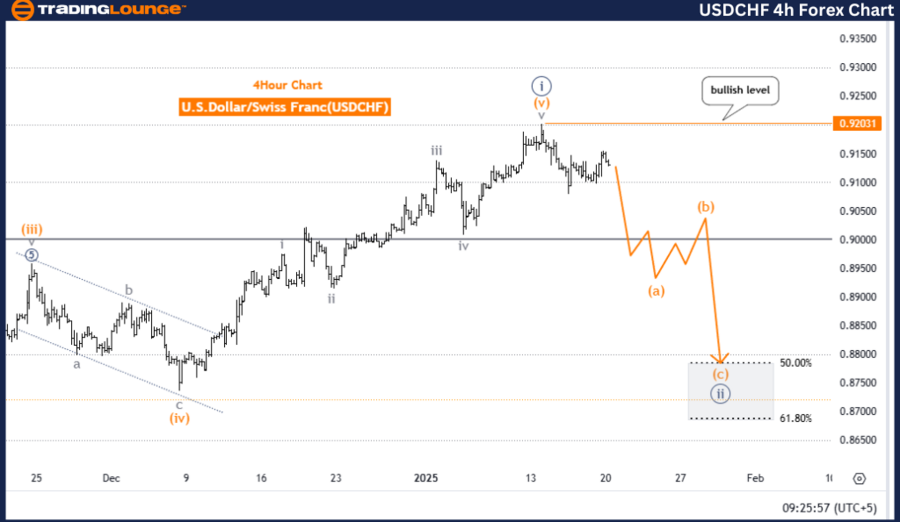
U.S. Dollar / Swiss Franc (USDCHF) Elliott Wave Analysis – 4-Hour Chart
USDCHF Elliott Wave Technical Analysis
Function: Counter Trend
Mode: Impulsive
Structure: Orange Wave A
Position: Navy Blue Wave 2
Next Higher Degree Direction: Orange Wave B
Details: Navy Blue Wave 1 has concluded, with Orange Wave A of 2 currently forming.
Wave Invalidation Level: 0.92031
The USDCHF 4-hour chart provides insights into an active counter-trend impulsive movement, driven by orange wave A, which forms part of the broader navy blue wave two corrective phase. This structure suggests an initial movement within a standard three-wave correction pattern, following the completion of navy blue wave one.
Currently, orange wave A is unfolding, signaling a critical stage in the ongoing counter-trend movement. The progression of this wave phase suggests further developments within the corrective sequence. The successful transition from navy blue wave one confirms the corrective nature of the current market phase.
The wave invalidation level is set at 0.92031, meaning any price action above this threshold would invalidate the current Elliott Wave structure, requiring a revised technical outlook. As long as the price remains below this level, the corrective pattern remains valid.
Tracking the development of orange wave A and the subsequent corrective patterns within navy blue wave two will provide valuable insights into future market direction and potential trend reversals.
Conclusion
In summary, the USDCHF 4-hour chart showcases an ongoing counter-trend correction characterized by orange wave A within navy blue wave two. This phase signifies an expected correction after navy blue wave one. The critical invalidation level of 0.92031 acts as a key threshold for maintaining the wave count's validity. As long as the price remains below this level, the counter-trend scenario is likely to persist, with further corrective movements expected in orange wave A.
Technical Analyst: Malik Awais
Source: visit Tradinglounge.com and learn From the Experts Join TradingLounge Here
Previous: GBPUSD Elliott Wave Technical Analysis
VALUE Offer - Buy 1 Month & Get 3 Months!Click here
Access 7 Analysts Over 200 Markets Covered. Chat Room With Support