EURUSD Elliott Wave Analysis Trading Lounge Day Chart,
Euro/U.S.Dollar(EURUSD) Day Chart
EURUSD Elliott Wave Technical Analysis
FUNCTION: Trend
MODE: impulsive
STRUCTURE:red wave 3
POSITION: blue wave 3
DIRECTION NEXT HIGHER DEGREES:red wave 4
DETAILS: red wave 2 looking completed at 1.08854 .Now red wave 3 of 3 is in play . Wave Cancel invalid level: 1.08854
The EUR/USD Elliott Wave Analysis for the Day Chart identifies a trend with impulsive characteristics, reflecting significant and consistent movement in one direction within the Elliott Wave structure. This technical analysis helps traders understand market momentum and potential shifts.
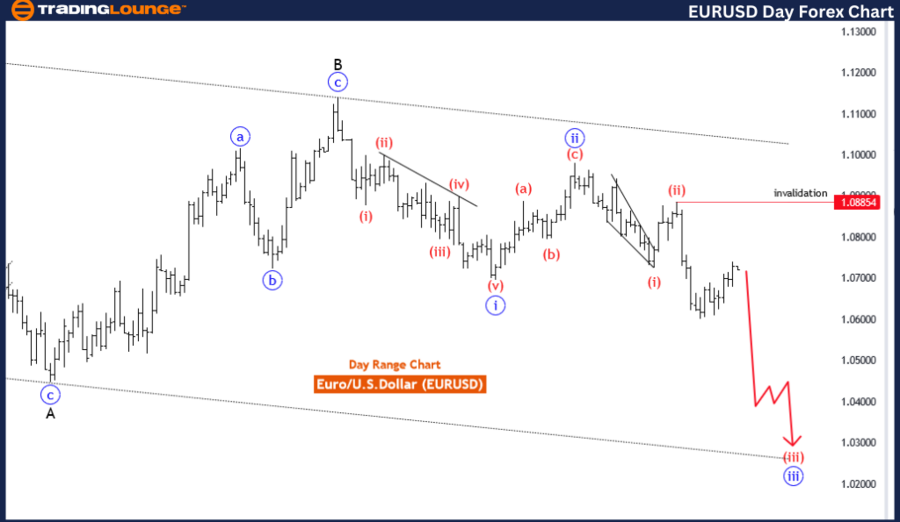
Function
The function is described as "Trend," indicating that the analysis is focused on the overall direction of the market, typically associated with impulsive waves that drive price action forward.
Mode
The mode is categorized as "impulsive," pointing to robust, one-directional movement, often linked to waves that exhibit strong trends and rapid price shifts. This mode typically represents the waves driving the broader trend.
Structure
The structure is "red wave 3," suggesting that the observed wave is the third wave in a larger Elliott Wave pattern. The third wave is generally the strongest among impulsive waves, indicating significant upward or downward momentum.
Position
The position is "blue wave 3," indicating that the analysis focuses on a specific segment of the broader wave structure. This positioning aligns with a mid-phase impulsive wave within the larger cycle.
Direction for the Next Higher Degrees
The expected direction for the next higher degrees is "red wave 4," which usually signifies a corrective phase following the completion of an impulsive wave. This direction suggests that once red wave 3 concludes, the market could enter a consolidation or retracement period before the next impulsive phase.
Details
The details provide more granular information about the wave structure. Red wave 2 is considered complete at the 1.08854 level, indicating that the corrective phase has likely ended, paving the way for red wave 3, which is now in play. This suggests a continuation of the impulsive trend, signifying strong market movement. The "Wave Cancel invalid level" at 1.08854 serves as a critical threshold, suggesting that if this level is breached, the current Elliott Wave structure would be invalidated, leading to a new interpretation of the market dynamics.
Overall, the EUR/USD Elliott Wave Analysis for the Day Chart points to a strong trend with impulsive movement in red wave 3, indicating significant momentum and directional movement. The completion of red wave 2 at 1.08854 suggests that the corrective phase has ended, with red wave 3 now driving the trend forward.
EURUSD Elliott Wave Analysis Trading Lounge 4-Hour Chart,
Euro/U.S.Dollar(EURUSD) 4 Hour Chart
EURUSD Elliott Wave Technical Analysis
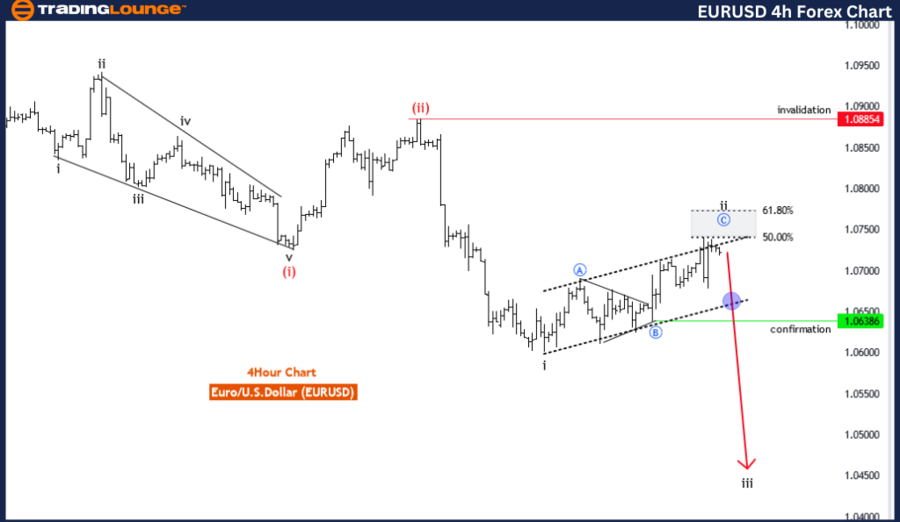
FUNCTION: Trend
MODE: impulsive
STRUCTURE: black wave 3
POSITION: Red Wave 3
DIRECTION NEXT HIGHER DEGREES: black wave 4
DETAILS: black wave 2 looking completed or near to end . Now looking for black wave 3 to play or is in play. Wave Cancel invalid level: 1.08854
The EUR/USD Elliott Wave Analysis for the 4-Hour Chart provides insights into the Euro versus the U.S. Dollar market using the Elliott Wave framework. This analysis identifies a trend scenario with impulsive characteristics, indicating the presence of strong directional movement within the observed wave structure.
Function
The function is described as "Trend," suggesting that the analysis explores a segment within the broader directional trend. This typically involves a focus on the impulsive waves that drive the primary market movement.
Mode
The mode is categorized as "impulsive," pointing towards a strong, one-directional movement. Impulsive modes are often associated with rapid price changes and suggest a clear trend pattern, as opposed to corrective phases that indicate consolidation or retracement.
Structure
The structure identified is "black wave 3," indicating that the observed wave pattern represents the third wave within the larger Elliott Wave cycle. Black wave 3 is typically 2 / 2 the strongest and longest among impulsive waves, indicating that the current trend may be gaining momentum.
Position
The position of the analysis is "red wave 3," denoting that the specific wave under consideration is part of the larger black wave 3. This positioning aligns with a mid-phase impulse within the broader wave structure.
Direction for the Next Higher Degrees
The expected direction for the next higher degrees is "black wave 4," indicating that after the completion of the current impulsive wave, the structure will likely transition into a corrective phase. Black wave 4 typically signifies a temporary retracement within a broader impulsive pattern.
Details
The details provide more specific information about the current wave structure. Black wave 2 is considered completed or near completion, suggesting that the impulsive phase (black wave 3) is about to commence or is already underway. This is a critical juncture in the Elliott Wave cycle, as it indicates a shift from a corrective phase to a renewed impulsive trend. The Wave Cancel invalid level is set at 1.08854, indicating a key threshold. If this level is breached, the current Elliott Wave structure would be invalidated, necessitating a new interpretation of the market pattern.
In summary, the EUR/USD Elliott Wave Analysis for the 4-Hour Chart focuses on an impulsive trend structure, with black wave 3 suggesting strong market momentum. The analysis anticipates the end of a corrective phase and the beginning of an impulsive wave, with a Wave Cancel invalid level providing a key point for maintaining the validity of the current Elliott Wave structure.
Technical Analyst: Malik Awais
Source: visit Tradinglounge.com and learn From the Experts Join TradingLounge Here
See Previous: British Pound/U.S.Dollar(GBPUSD)
Special Trial Offer - 0.76 Cents a Day for 3 Months! Click here
Access 6 Analysts covering over 150 Markets. Chat Room With Support