WTI Crude Oil Elliott Wave Technical Analysis
Crude oil prices are trending sideways, holding below $73 as momentum weakens. A bearish breakout seems more likely, targeting levels around $60. However, the price must first break through the $64-62 support zone, which could provide temporary resistance to the decline.
WTI Crude Oil Commodity Daily Chart Analysis
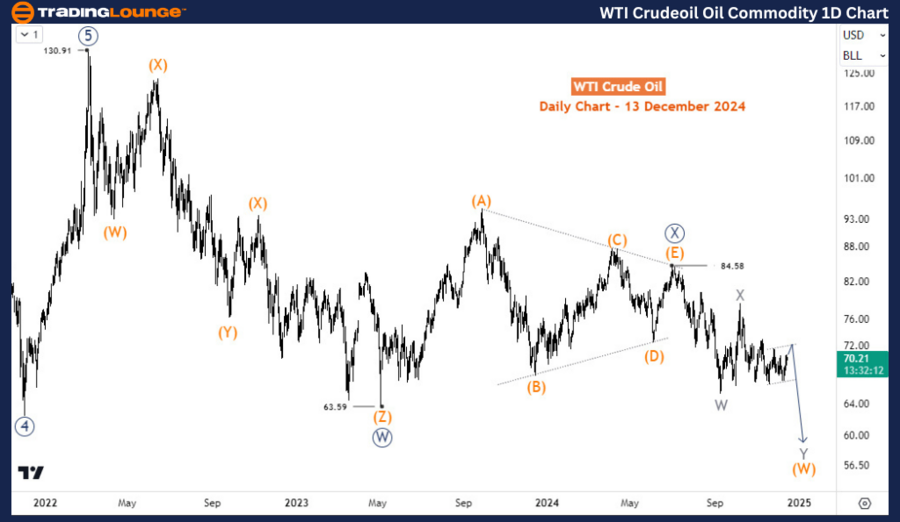
From a long-term perspective, WTI crude oil prices are correcting the impulsive rally observed between April 2020 and March 2022, when prices surged close to $131. The ongoing decline from March 2022 appears to be forming a double-zigzag corrective pattern.
The decline from $84.5 (July 2024) is currently evolving into wave ((Y)), although this wave remains in its early stages. The price finalized wave W of (W) of ((Y)) in September 2024, followed by wave Y of (W) in October 2024. The ongoing wave Y of (W) is incomplete, with projections suggesting a potential drop to the $61-57 range.

WTI Crude Oil Commodity H4 Chart Analysis
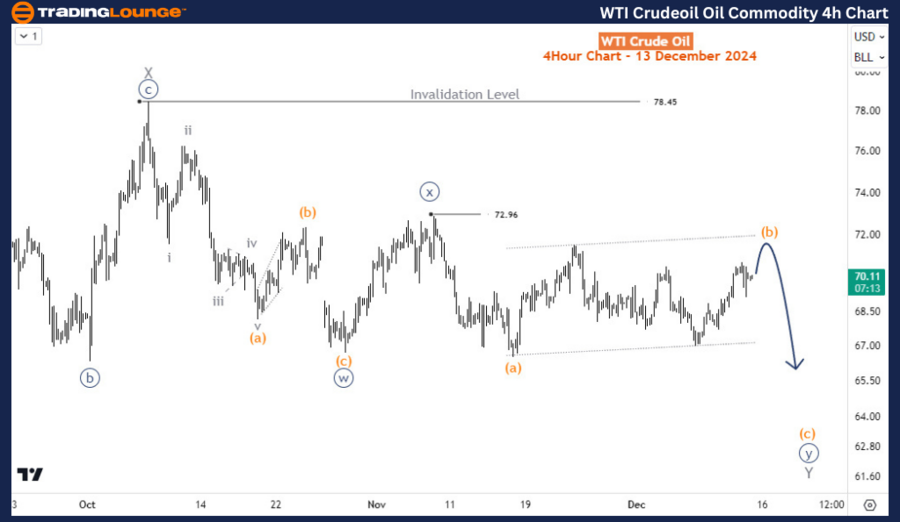
On the H4 timeframe, WTI crude is presently in wave (b) of ((y)) of Y, provided the $72.96 level holds. A break below $72.76, however, could signal the formation of a new potential top for wave ((x)), assuming the price remains below the invalidation level of $78.45. As long as WTI stays beneath $78.45, the probability of further downside remains higher than that of a bullish reversal.
Technical Analyst: Sanmi Adeagbo
Source: visit Tradinglounge.com and learn From the Experts Join TradingLounge Here
See Previous: GX Uranium ETF Elliott Wave Technical Analysis
VALUE Offer - Buy 1 Month & Get 3 Months!Click here
Access 7 Analysts Over 200 Markets Covered. Chat Room With Support
