Elliott Wave Analysis of Dogecoin/U.S. Dollar (DOGEUSD): Navigating the Market's Currents
Introduction: Elliott Wave Theory offers a sophisticated framework for predicting market movements by analyzing waves of investor sentiment and psychological states. This analysis provides insights into the current patterns and potential future movements of Dogecoin against the U.S. dollar (DOGEUSD), focusing on both daily and H4 chart perspectives. By understanding these wave structures and the associated technical indicators, traders can refine their strategies for entering and exiting positions in DOGEUSD.
DOGEUSD Elliott Wave Technical Analysis
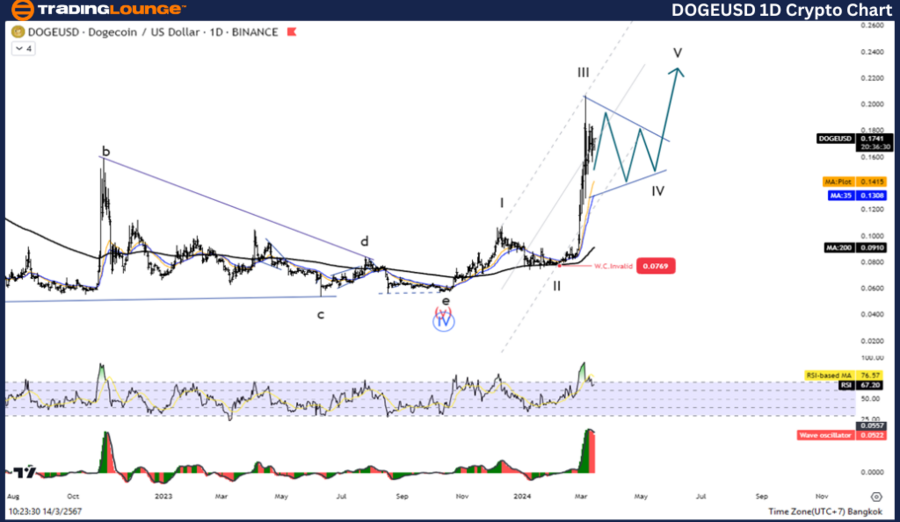
DOGEUSD Elliott Wave Analysis on the Daily Chart
Technical Overview:
- Function: Counter trend
- Mode: Corrective
- Structure: Zigzag
- Position: Wave ((C))
- Direction for Higher Degrees: Wave I of an Impulse
- Invalidation Level: Not specified
- Current Status: In the corrective phase of Wave 4, setting the stage for an upcoming uptrend.
Market Behavior and Strategy: The current analysis of DOGEUSD reveals a fourth-wave correction that is anticipated to decline to the 0.1169 support level before a resurgence in the fifth wave can occur. This suggests a short-term pullback is in play, which is typical in a zigzag correction pattern where the market adjusts before continuing its primary trend. Investors should monitor this corrective phase closely and consider re-entering the market as the downtrend completes and the fifth wave begins to materialize, indicating a potential uptrend.
Technical Indicators:
- Moving Averages: Price positioned above the 200-day moving average (MA200) signals a prevailing downtrend.
- Wave Oscillator: Indicates bearish momentum, aligning with the expected corrective decline.
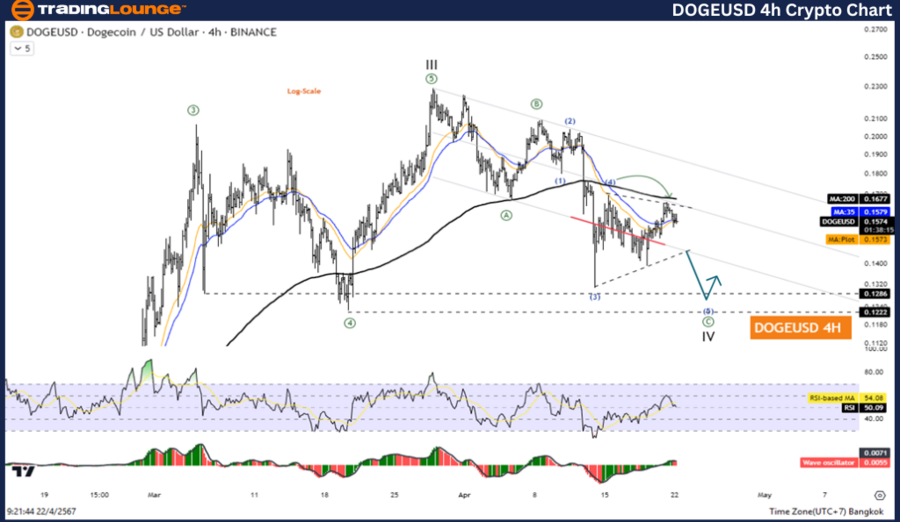
DOGEUSD Elliott Wave Analysis on the 4H Chart
DOGEUSD Technical Analysis
Technical Overview:
- Function: Follow the trend
- Mode: Motive
- Structure: Impulse
- Position: Wave (5)
- Direction for Higher Degrees: Wave ((C)) of a Zigzag
- Invalidation Level: Not specified
- Current Status: Awaiting a final downward move in wave 5 to transition into an uptrend.
Market Behavior and Strategy: In the shorter H4 timeframe, DOGEUSD is poised for another drop as part of its ongoing fifth wave. This movement is critical as it precedes a potential reversal into an uptrend. Similar to the daily chart analysis, traders should prepare for this decline, which serves as a strategic entry point for those looking to capitalize on the forthcoming upward momentum. Patience is required until the correction fully plays out.
Technical Indicators:
- Moving Averages: Consistency with the daily chart, the price above MA200 indicates the market is still navigating a downtrend.
- Wave Oscillator: Reinforces bearish sentiment, supporting the likelihood of continued downward movement before reversing.
Conclusion The Elliott Wave analysis for DOGEUSD on both daily and H4 charts indicates a strategic play of waiting through the corrective phases to seize opportunities during the anticipated upward trends. While the market exhibits short-term declines, the overarching bullish signals should not be overlooked. Traders are advised to remain vigilant, watching for the completion of the current waves, which will likely offer favourable conditions for re-entry into the market. As always, maintaining an eye on technical indicators and wave structures will be key to navigating these volatile cryptocurrency waters effectively.
Technical Analyst: Kittiampon Somboonsod
Source: visit Tradinglounge.com and learn From the Experts Join TradingLounge Here
See Previous: Cardano/ U.S. dollar(ADAUSD)
TradingLounge's Free Week Extravaganza!
April 14 – 21: Unlock the Doors to Trading Excellence — Absolutely FREE