BHARAT Electronics Ltd. (BEL) – Elliott Wave Technical Analysis 1D Chart
BEL Elliott Wave Analysis
Function: Larger Degree Trend Higher (Intermediate degree, orange)
Mode: Motive
Structure: Impulse
Position: Minute Wave ((ii)) Navy
Key Details:
- Current Progress: Minute Wave ((iii)) Navy of Minor Wave 5 Grey is advancing higher, holding against 229.
- Alternate Count: Wave 5 Grey might have concluded above 342.
- Invalidation Point: 229
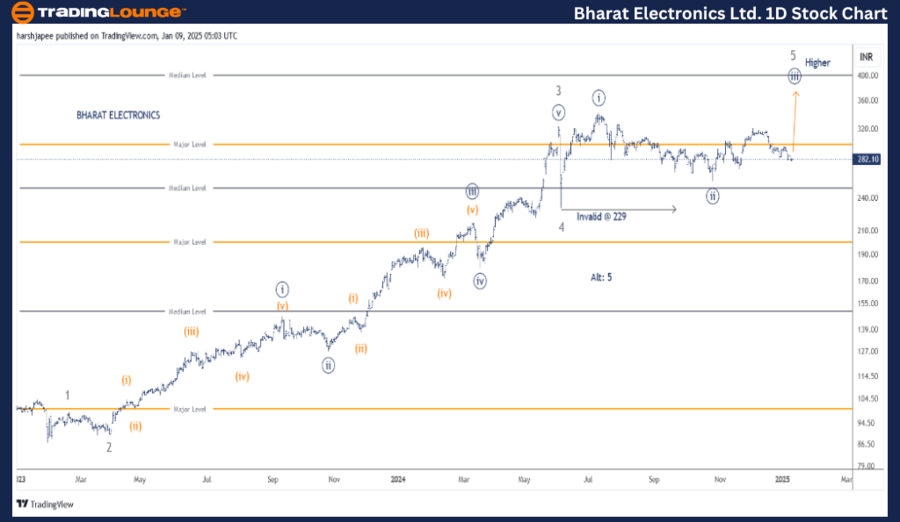
Daily Chart Analysis:
BEL’s daily chart suggests a sustained upward trend, potentially within its final Minor Wave 5 Grey, aiming for the 400 level. The stock must remain above 229, the termination point for Minor Wave 4, to sustain this bullish trajectory.
Since the dip below 90 in January 2023, which likely marked the end of Intermediate Wave (4), BEL has been in a consistent uptrend. This rally appears subdivided into Minor Waves 1 through 4. Notably, Minor Wave 3 extended significantly, reaching highs around 326.
Minor Wave 4 bottomed near 229, and the ongoing Minor Wave 5 suggests bulls are preparing for another surge. The 229 mark serves as the critical support for this bullish outlook.
BHARAT Electronics Ltd. (BEL) – Elliott Wave Technical Analysis 4H Chart
BEL Elliott Wave Analysis
Function: Larger Degree Trend Higher (Intermediate degree, orange)
Mode: Motive
Structure: Impulse
Position: Minute Wave ((ii)) Navy
Key Details:
- Current Progress: Minute Wave ((iii)) Navy of Minor Wave 5 Grey is advancing above the 229 support. Prices should stay above 259 to validate the structure.
- Alternate Count: Wave 5 Grey might have concluded above 342.
- Invalidation Point: 229
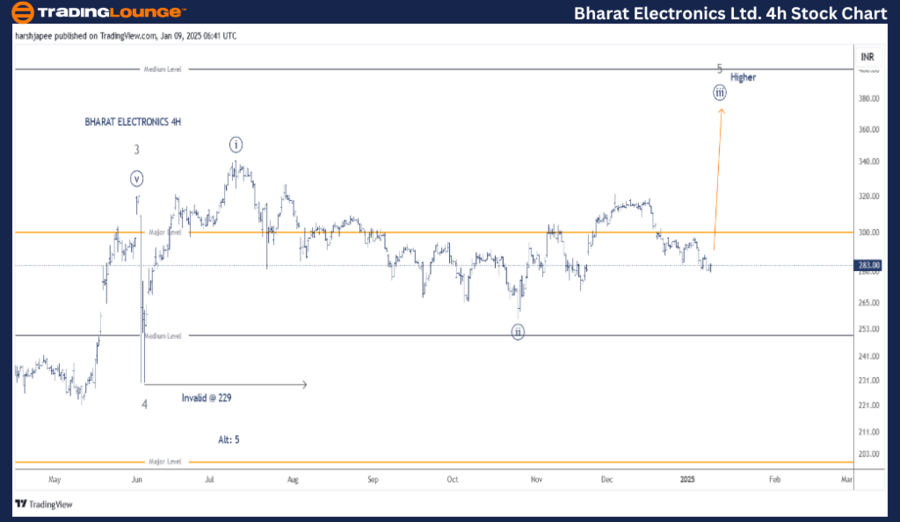
4H Chart Analysis:
The 4-hour chart provides insight into the sub-waves unfolding post-Minor Wave 4 Grey, which ended near 229 in June 2024. Minute Wave ((i)) appears to have completed around 342, followed by Minute Wave ((ii)) terminating near 259. The ongoing Minute Wave ((iii)) seems to be extending further.
For this bullish structure to hold, prices must remain above the 259 level and, ideally, above 229. A breakout above 318 would reinforce bullish control, with potential targets exceeding 380 in the coming sessions.
Technical Analyst: Harsh Japee
Source: visit Tradinglounge.com and learn From the Experts Join TradingLounge Here
Previous: ITC LTD Elliott Wave Technical Analysis
VALUE Offer - Buy 1 Month & Get 3 Months!Click here
Access 7 Analysts Over 200 Markets Covered. Chat Room With Support
Conclusion:
BEL remains in an upward trajectory within Minute Wave ((iii)) of Minor Wave 5 Grey. The critical support at 229 underpins the bullish sentiment, while a move above 318 could signal further strength toward the 400 level.