Gold (XAUUSD) Commodity Elliott Wave Analysis

Gold Elliott Wave Technical Analysis

Function: Trend

Mode: Corrective

Structure: Likely Zigzag

Position: Wave A of (4)

Direction: Wave B of (4)

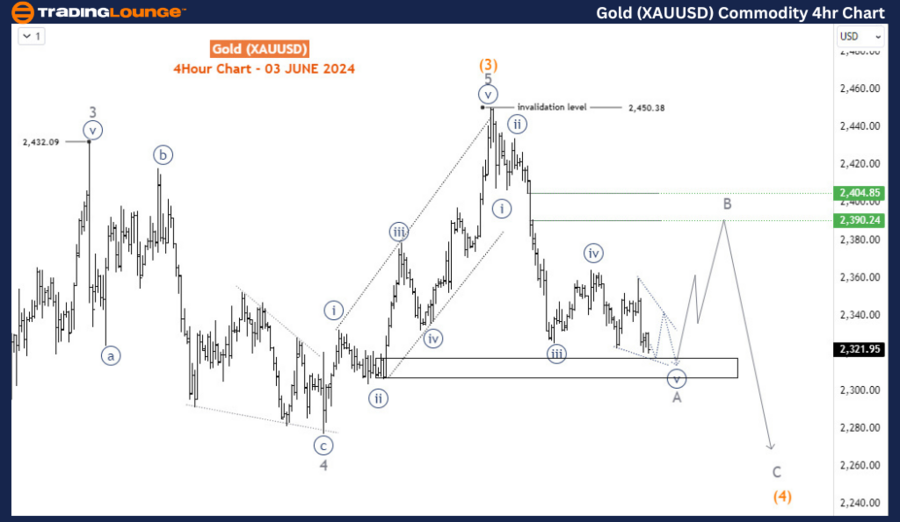
Details: Gold could find support soon for wave A, followed by a wave B retracement towards the 2390-2404 key price zone.

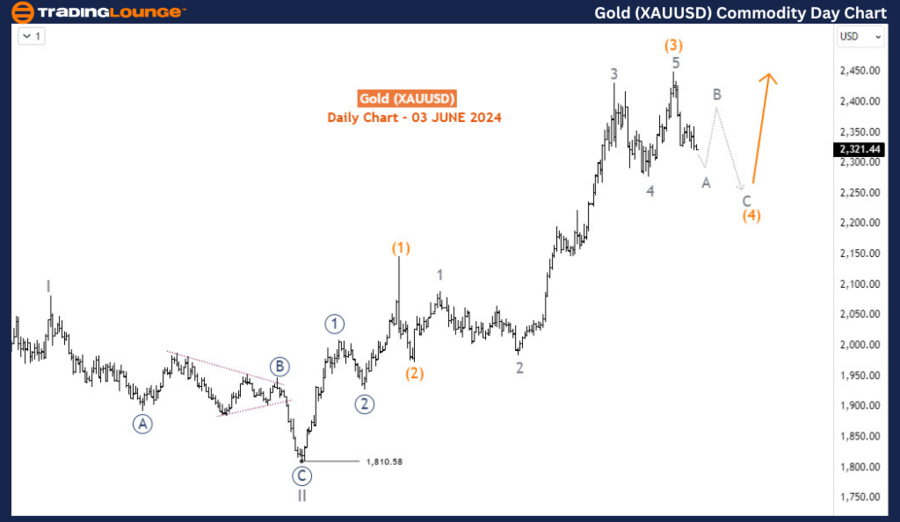
Since the current sell-off began on May 20, 2024, gold bulls have taken temporary control. However, prices are now approaching a key support zone where a potential recovery might occur. Despite this, any recovery is expected to lead to another leg lower in the medium term. Once the pullback concludes, the market anticipates the bullish run that started in September 2022 to resume, potentially driving prices to a fresh all-time high.

Gold Daily Chart Analysis

On the daily chart, the rally resumed at 1810 in October 2023 after the previous pullback from May 2023 was completed. At 1810.58, cycle degree wave II ended, and wave III began. The high on May 20, 2024, marked the peak of the intermediate degree wave (3) of the primary degree wave 3 (circled in blue), indicating that the bullish trend remains intact. The current pullback is forming intermediate degree wave (4), which, once completed, will pave the way for the bullish trend to continue higher in wave (5).
Gold-XAUUSD-Day-comm...


Gold 4-Hour Chart Analysis

The H4 chart shows that the price is close to completing wave A of (4) with an impulse wave structure. Additionally, gold is nearing a key price zone where it could find support, allowing wave B to initiate a corrective recovery towards 2390.2-2404.85. Following the completion of wave B, wave C of (4) is expected to continue downward, completing the corrective phase. Although the overall trend is bullish, the ongoing pullback from 2450.38 has not yet finished, suggesting that prices could drop further before resuming the upward trend.

Technical Analyst: Sanmi Adeagbo

Source: visit Tradinglounge.com and learn From the Experts Join TradingLounge Here 

See Previous: Copper Elliott Wave Technical Analysis

Special Trial Offer - 0.76 Cents a Day for 3 Months! Click here

Access 7 Analysts Over 170 Markets Covered. Chat Room With Support
Gold-XAUUSD-4Hr-comm...

In summary, gold prices are in a pullback phase following the sell-off that began on May 20, 2024. This pullback is approaching a key support zone where a temporary recovery might occur, but it is expected to lead to another leg lower in the medium term. The daily chart indicates that the bullish trend, which started in September 2022 and resumed at 1810 in October 2023, remains unbroken. The current pullback is forming intermediate wave (4), with wave (5) anticipated to drive prices higher once the correction is complete. The H4 chart suggests that wave A of (4) is nearing completion, with wave B expected to recover towards 2390.2-2404.85 before wave C continues downward. Traders should monitor the key support zone and the development of wave B to time their entries for the next phase of the bullish trend.

Related

U.S.Dollar/Swiss Franc(USDCHF) Elliott Wave Technical Analysis 8 January 24

U.S.Dollar/Swiss Franc(USDCHF) Elliott Wave Technical Analysis 8 January 24

Trading Lounge USDCHF Elliott Wave Analysis dated 8 January 24, provides a comprehensive analysis of...

Read More >
NASDAQ STOCKS, AAPL, AMZN, NVDA, META, NFLX, GOOGL, MSFT, TSLA. Elliott Wave Analysis

NASDAQ STOCKS, AAPL, AMZN, NVDA, META, NFLX, GOOGL, MSFT, TSLA. Elliott Wave Analysis

Our latest Elliott Wave analysis for NASDAQ and SP500 stocks indicates that many tech stocks are con...

Read More >
Elliott Wave Technical Analysis for Walmart Inc. (WMT), Including Detailed Forecasts and Current Price Movements

Elliott Wave Technical Analysis for Walmart Inc. (WMT), Including Detailed Forecasts and Current Price Movements

Explore the most recent Elliott Wave analysis for Walmart Inc. (WMT), including detailed forecasts a...

Read More >
Euro/British Pound Forex trading and improve your strategy with accurate EURGBP Elliott Wave forecasts and signals

Euro/British Pound Forex trading and improve your strategy with accurate EURGBP Elliott Wave forecasts and signals

This comprehensive EURGBP Elliott Wave analysis provides a detailed look into the market’s current ...

Read More >
NEOUSD Cryptocurrency Analysis: A Comprehensive Elliott Wave Technical Perspective

NEOUSD Cryptocurrency Analysis: A Comprehensive Elliott Wave Technical Perspective

This article offers a deep dive into the NEOUSD market, providing a detailed Elliott Wave analysis t...

Read More >
Walmart Inc.(WMT:NYSE) Elliott Wave Technical Analysis 2 November 23

Walmart Inc.(WMT:NYSE) Elliott Wave Technical Analysis 2 November 23

Walmart Inc.(WMT:NYSE) Elliott Wave Technical Analysis on 2 November 23, WMT Stock Market Analysis b...

Read More >

Buy 1 Month

Get 3 Months!

Special Offer:

Trade Recommendations

Unleash the power of deversified trading with our comprehensive portfolio, covering:

  • Stock Trades
  • Crypto Trades
  • Forex Trades
  • Commodity Trades
Elliott Wave Analysis

Gain a competive edge with expert insights in to:

  • Global Indices
  • US Stocks & ASX Stocks
  • Forex & Crypto
  • Commodities
Top-Notch Trading Tools

Equip yourself with the tools of success:

  • Social Chat
  • Elliott Wave Algorithm
  • Screener
  • TradingLevels
  • Trading Game
7 Elliott Wave Analysts

Stay ahead of the market with daily charts and insightful videos
-Your secret to strategic trading!

JOIN HERE


Welcome to TradingLounge (ASIC A.R.No. 321187), specialists in trades, trading education and technical analysis, covering stocks, indices, commodities, forex and cryptocurrencies.

When you join TradingLounge you have access to everything we offer, including trade tools, educational content and a social platform to chat with like-minded investors.

Read more

@Copyright 2024 by tradinglounge.com

Contact Us

Australian no: 02 4787 6020

International no: +61 (2) 47876020

Pay with:

Find us on