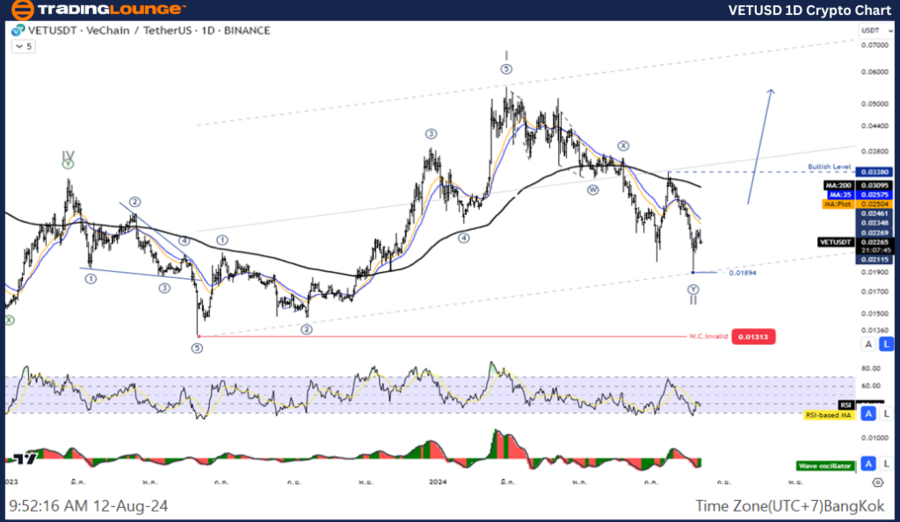
VETUSD Elliott Wave Analysis – TradingLounge Daily Chart

VeChain / U.S. Dollar (VETUSD) Daily Chart Analysis

VETUSD Elliott Wave Technical Analysis

Function: Counter Trend

Mode: Corrective

Structure: Double Corrective

Position: Wave ((Y))

Next Higher Degree Direction: Wave II of Impulse

Invalidation Level: N/A

Details: Wave II is potentially complete, signaling a potential price increase as Wave III begins.

VeChain / U.S. Dollar (VETUSD) Trading Strategy:

The current trend in VeChain appears to be concluding, as the price action in Wave 1 likely ends. The market is entering a corrective phase in Wave 2, which might test the 50-61.8% retracement level of Wave 1 before the next upward move in Wave 3. Traders should consider this as a potential opportunity to re-enter the trend.

VeChain / U.S. Dollar (VETUSD) Technical Indicators:

  • The price is trading below the MA200, indicating a bearish trend.
  • The Wave Oscillator suggests bearish momentum.

VETUSD-1D-Crypto-Cha...


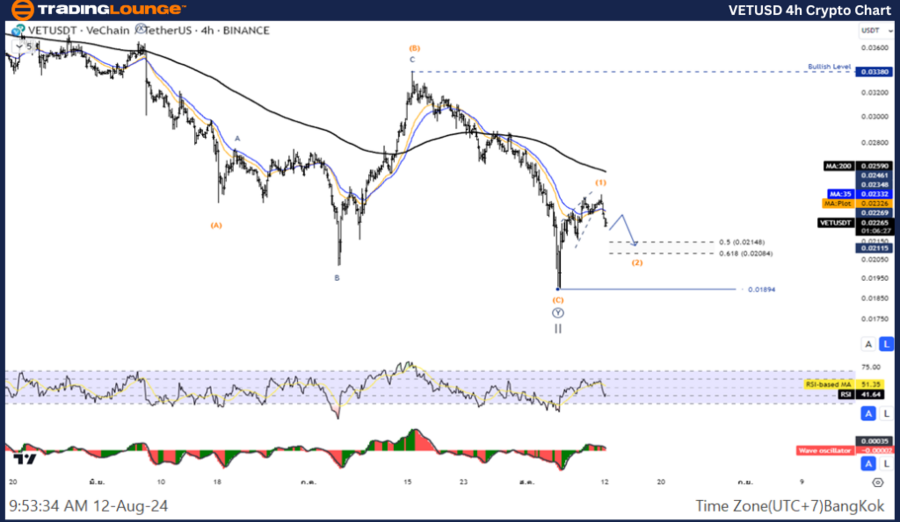
VETUSD Elliott Wave Analysis – TradingLounge 4-Hour Chart

VeChain / U.S. Dollar (VETUSD) 4-Hour Chart Analysis

VETUSD Elliott Wave Technical Analysis

Function: Counter Trend

Mode: Corrective

Structure: Double Corrective

Position: Wave ((Y))

Next Higher Degree Direction: Wave II of Impulse

Invalidation Level: N/A

Details: Wave II might be complete, which could lead to a price increase as Wave III develops.

VeChain / U.S. Dollar (VETUSD) Trading Strategy:

The VeChain trend seems to be reaching its end, as the price action in Wave 1 is likely concluding. The market is entering Wave 2, a corrective phase that could test the 50-61.8% retracement level of Wave 1 before continuing the upward movement in Wave 3. This scenario offers traders a potential opportunity to rejoin the trend.

VeChain / U.S. Dollar (VETUSD) Technical Indicators:

  • The price is below the MA200, indicating a bearish trend.
  • The Wave Oscillator shows bearish momentum.

Technical Analyst:  Kittiampon Somboonsod

Source: visit Tradinglounge.com and learn From the Experts Join TradingLounge Here 

See Previous: XRP/USD (XRPUSD) Elliott Wave Technical Analysis

Special Trial Offer - 0.76 Cents a Day for 3 Months! Click here

Access 7 Analysts Over 170 Markets Covered. Chat Room With Support

VETUSD-4h-Crypto-Cha...

Related

Nifty 50 Elliott Wave Bullish Impulse Wave 3 on Daily & Weekly – Watch Invalidation Level 24384, Await Wave 2 Pullback

Nifty 50 Elliott Wave Bullish Impulse Wave 3 on Daily & Weekly – Watch Invalidation Level 24384, Await Wave 2 Pullback

Elliott Wave analysis on Nifty 50 shows bullish impulsive Wave 3 in progress on daily and weekly cha...

Read More >
Costco Wholesale Corp. (COST) Elliott Wave Chart Signals Start of Bearish Wave C with Key Support Levels and Trade Setup Potential

Costco Wholesale Corp. (COST) Elliott Wave Chart Signals Start of Bearish Wave C with Key Support Levels and Trade Setup Potential

Costco’s stock appears to have completed wave (B) near $1000. Elliott Wave analysis suggests a bear...

Read More >
Unlocking ASX Trading Success: COCHLEAR LIMITED - COH Stock Analysis & Elliott Wave Technical Forecast

Unlocking ASX Trading Success: COCHLEAR LIMITED - COH Stock Analysis & Elliott Wave Technical Forecast

COCHLEAR LIMITED (COH) stock on the Australian Stock Exchange (ASX) using Elliott Wave theory, provi...

Read More >
Australian Dollar / Japanese Yen(AUDJPY) Elliott Wave Technical Analysis 14 November 23

Australian Dollar / Japanese Yen(AUDJPY) Elliott Wave Technical Analysis 14 November 23

Australian Dollar / Japanese Yen(AUDJPY) Elliott Wave Technical Analysis 14 November 23, In summary,...

Read More >
Ethereum/ U.S. dollar(ETHUSD) Elliott Wave Technical Analysis: Potential Upside Moves in Ethereum's Uptrend

Ethereum/ U.S. dollar(ETHUSD) Elliott Wave Technical Analysis: Potential Upside Moves in Ethereum's Uptrend

This post provides detailed Elliott Wave analysis for Ethereum against the US dollar (ETHUSD), focus...

Read More >
Hang Seng Trading and Investing: Hang Seng Index Elliott Wave Technical Analysis, HSI Trends, and Market Insights

Hang Seng Trading and Investing: Hang Seng Index Elliott Wave Technical Analysis, HSI Trends, and Market Insights

Discover the latest Hang Seng Index (HSI) analysis using Elliott Wave theory. Gain valuable insights...

Read More >

$1 for 2 Weeks

then $29 a month!

What a Special Offer!

Trade Recommendations

Unleash the power of deversified trading with our comprehensive portfolio, covering 250+ markets:

  • Stock Trades
  • Crypto Trades
  • Forex Trades
  • Commodity Trades
Elliott Wave Analysis

Gain a competitive edge with expert insights and AI-powered Elliott Wave charting into:

  • Global Indices
  • US Stocks & ASX Stocks
  • Forex & Crypto
  • Commodities
Top-Notch Trading Tools

Equip yourself with the tools of success:

  • Real-time Chat rooms
  • Elliott Wave Algorithm
  • Portfolio tools
  • TradingLevels
  • Screener
  • Trading Game
7 Elliott Wave Analysts

Stay ahead of the market with daily charts and insightful videos
Your secret to strategic trading!

JOIN HERE


Welcome to TradingLounge (ASIC A.R.No. 321187), specialists in trades, trading education and technical analysis, covering stocks, indices, commodities, forex and cryptocurrencies.

When you join TradingLounge you have access to everything we offer, including trade tools, educational content and a social platform to chat with like-minded investors.

Read more

@Copyright 2024 by tradinglounge.com

Contact Us

Australian no: 02 4787 6020

International no: +61 (2) 47876020

Pay with:

Find us on