19Jun

State Bank of India Elliott Wave Analysis: Daily corrective Wave 2 and Weekly bullish Wave 5 insights with forecasted breakout potential

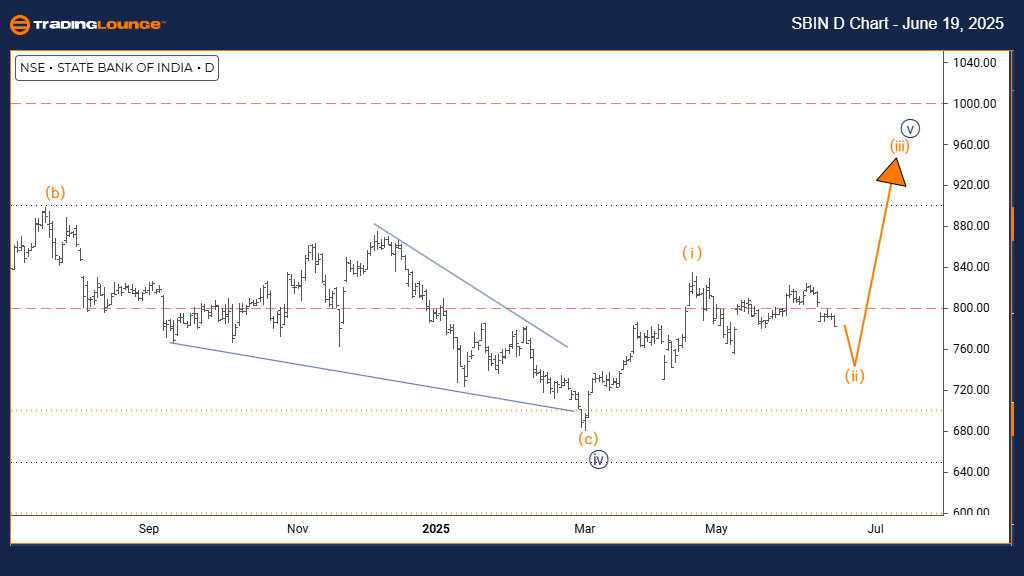
STATE BANK OF INDIA Elliott Wave Analysis – Trading Lounge Day Chart

STATE BANK OF INDIA Elliott Wave Technical Analysis

FUNCTION: Counter Trend

MODE: Corrective

STRUCTURE: Orange Wave 2

POSITION: Navy Blue Wave 5

DIRECTION NEXT HIGHER DEGREES: Orange Wave 3

DETAILS: Orange Wave 1 has completed; Orange Wave 2 is currently in progress.

The daily Elliott Wave analysis for STATE BANK OF INDIA outlines a corrective counter-trend formation, signaling a temporary price retracement within the broader trend framework. The correction is occurring as Orange Wave 2, nested within Navy Blue Wave 5, part of the larger Elliott structure. This behavior is typical of a temporary pullback before the main trend resumes.

With Orange Wave 1 likely finalized, Orange Wave 2 begins its corrective development. This aligns with expected Elliott Wave behavior, where Wave 2 commonly retraces a portion of Wave 1. The next key phase is projected to be Orange Wave 3, which will emerge once the current correction completes, potentially initiating a stronger price move aligned with the broader wave direction.

Present signals indicate that STATE BANK OF INDIA is progressing through Orange Wave 2. This phase may involve sideways price action or light retracement, consistent with standard corrective market behavior. The wave’s placement within Navy Blue Wave 5 supports the ongoing corrective narrative.

SBIN-d-indian-chart-...


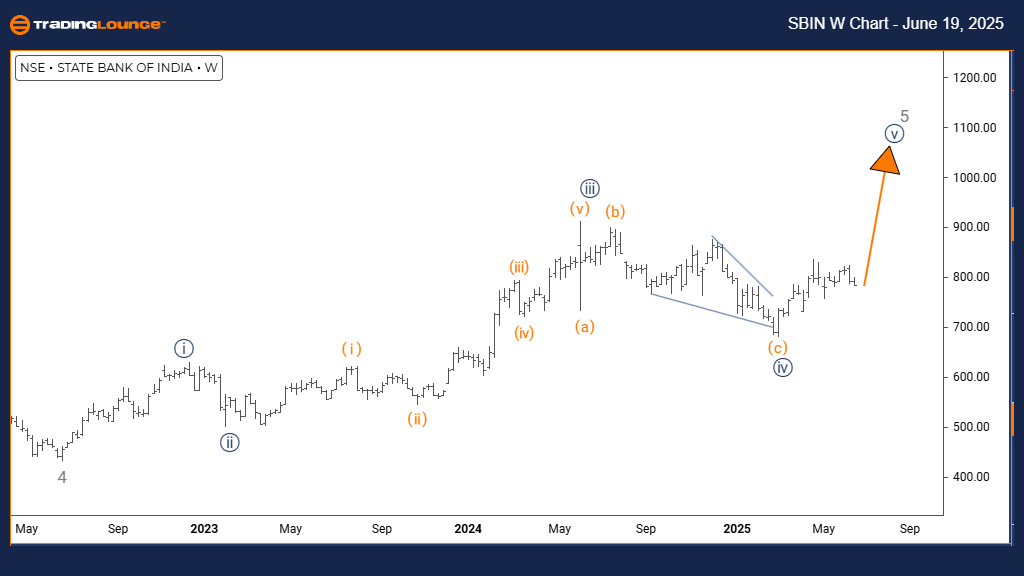
STATE BANK OF INDIA Elliott Wave Analysis – Trading Lounge Weekly Chart

STATE BANK OF INDIA Elliott Wave Technical Analysis

FUNCTION: Bullish Trend

MODE: Impulsive

STRUCTURE: Navy Blue Wave 5

POSITION: Gray Wave 5

DIRECTION NEXT HIGHER DEGREES: Navy Blue Wave 5 (ongoing)

DETAILS: Completion of Navy Blue Wave 4 confirmed; Navy Blue Wave 5 in progress.

The weekly Elliott Wave outlook for STATE BANK OF INDIA highlights an impulsive bullish trend, currently unfolding as Navy Blue Wave 5, part of a broader Gray Wave 5 structure. This setup typically indicates strong momentum with potential for continuation before the trend completes.

The end of Navy Blue Wave 4 has likely been reached, giving way to Navy Blue Wave 5, which traditionally represents the final leg in a classic five-wave impulse sequence. This phase often shows significant strength, signaling a sustained bullish move.

With technical indicators supporting this outlook, STATE BANK OF INDIA may continue to show upward momentum, though traders should stay alert for any early signs of exhaustion or reversal, typical near the end of a fifth wave.

Technical Analyst: Malik Awais

Source: Visit Tradinglounge.com and learn from the Experts. Join TradingLounge Here

Previous: MAHINDRA & MAHINDRA Elliott Wave Technical Analysis

VALUE Offer - $1 for 2 Weeks then $29 a month!Click here

Access 7 Analysts Over 200 Markets Covered. Chat Room With Support

SBIN-w-indian-chart-...

Related

Visa Inc.(V:NYSE) Elliott Wave Technical Analysis 23 November 23

Visa Inc.(V:NYSE) Elliott Wave Technical Analysis 23 November 23

Visa Inc.(V: NYSE) Elliott Wave Technical Analysis Dated 23 November 23 with 1Hr and 4Hr Chart,

Read More >
TITAN COMPANY Stock Elliott Wave Technical Analysis: Stock Currently Progressing within a Corrective Wave Structure

TITAN COMPANY Stock Elliott Wave Technical Analysis: Stock Currently Progressing within a Corrective Wave Structure

This article provides an in-depth Elliott Wave analysis of TITAN Company stock, including detailed f...

Read More >
Discover the stock's Price Predictions, Technical Indicators, and Expected Market Movements: JSW Steel Elliott Wave Analysis

Discover the stock's Price Predictions, Technical Indicators, and Expected Market Movements: JSW Steel Elliott Wave Analysis

This article provides an in-depth Elliott Wave analysis of JSW Steel, highlighting potential stock p...

Read More >
Caterpillar Inc. Elliott Wave Technical Analysis: Corrective Wave Trends, Technical Patterns, and Price Target Insights for Traders

Caterpillar Inc. Elliott Wave Technical Analysis: Corrective Wave Trends, Technical Patterns, and Price Target Insights for Traders

Caterpillar Inc. (CAT), highlighting potential bottom formations in wave {iv} and future price targe...

Read More >
Euro/British Pound(EURGBP) 4 Hour Chart EURGBP Elliott Wave Technical Analysis 13 October 23

Euro/British Pound(EURGBP) 4 Hour Chart EURGBP Elliott Wave Technical Analysis 13 October 23

The EUR/GBP Elliott Wave Analysis for 13 October 23, serves as a valuable guide for traders and inve...

Read More >

$1 for 2 Weeks

then $29 a month!

What a Special Offer!

Trade Recommendations

Unleash the power of deversified trading with our comprehensive portfolio, covering 250+ markets:

  • Stock Trades
  • Crypto Trades
  • Forex Trades
  • Commodity Trades
Elliott Wave Analysis

Gain a competitive edge with expert insights and AI-powered Elliott Wave charting into:

  • Global Indices
  • US Stocks & ASX Stocks
  • Forex & Crypto
  • Commodities
Top-Notch Trading Tools

Equip yourself with the tools of success:

  • Real-time Chat rooms
  • Elliott Wave Algorithm
  • Portfolio tools
  • TradingLevels
  • Screener
  • Trading Game
7 Elliott Wave Analysts

Stay ahead of the market with daily charts and insightful videos
Your secret to strategic trading!

JOIN HERE


Welcome to TradingLounge (ASIC A.R.No. 321187), specialists in trades, trading education and technical analysis, covering stocks, indices, commodities, forex and cryptocurrencies.

When you join TradingLounge you have access to everything we offer, including trade tools, educational content and a social platform to chat with like-minded investors.

Read more

@Copyright 2024 by tradinglounge.com

Contact Us

Australian no: 02 4787 6020

International no: +61 (2) 47876020

Pay with:

Find us on