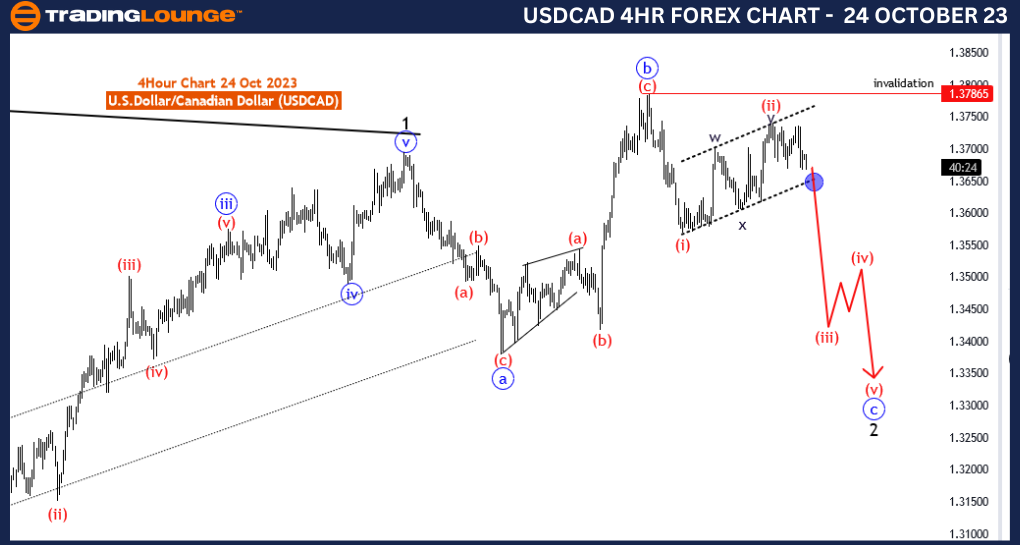
USD/CAD Elliott Wave Analysis Trading Lounge 4 Hour Chart, 24 October 23
U.S.Dollar /Canadian Dollar(USD/CAD) 4 Hour Chart
USD/CAD Elliott Wave Technical Analysis
Function: Counter Trend
Mode: impulsive as C of flat
Structure: Flat
Position: black wave 2
Direction Next Higher Degrees:Black wave 3
Details: red wave 3 of blue wave C of Flat starts . Wave Cancel invalid level : 1.37865
The USD/CAD Elliott Wave Analysis for the 4-hour chart on 24 October 23, offers valuable insights into the U.S. Dollar/Canadian Dollar (USD/CAD) currency pair. This analysis helps traders understand potential market dynamics and trading opportunities.
The function is labeled as "Counter Trend," indicating that the current price movement is against the prevailing trend. This suggests a possible reversal or correction in the market, making it essential information for traders.
The "impulsive" mode implies that the counter-trend move is strong and powerful, potentially leading to significant price changes. This makes it a crucial area of interest for traders, especially those looking for short- to medium-term opportunities.
The analysis focuses on the "C of flat" structure, highlighting a specific phase within the broader market structure. Understanding this wave pattern is essential for traders seeking potential trend reversals or corrections.
The report indicates that "red wave 3 of blue wave C of Flat starts." This signals the beginning of a new impulsive phase, which could lead to notable price movements. Recognizing this transition is vital for traders, as it offers potential trading opportunities.
The "Wave Cancel invalid level: 1.37865" serves as a critical reference point. It indicates the level at which the described wave structure would be invalidated, suggesting a change in market dynamics.
In summary, the USD/CAD Elliott Wave Analysis for 24 October 23, provides significant insights into the USD/CAD currency pair. The commencement of red wave 3 of blue wave C of Flat is a key point of focus. Traders should closely monitor the market for potential trading opportunities, while also keeping an eye on the provided invalidation level to manage risk effectively.
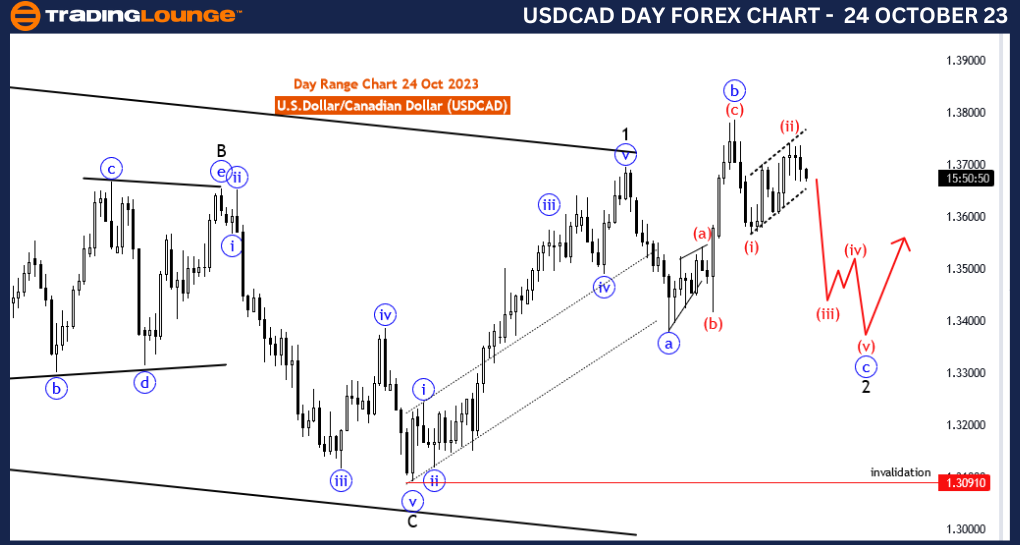
USD/CAD Elliott Wave Analysis Trading Lounge Day Chart, 24 October 23
U.S.Dollar /Canadian Dollar(USD/CAD) Day Chart
USD/CAD Elliott Wave Technical Analysis
Function: Counter Trend
Mode: impulsive as C of flat
Structure: Flat
Position: black wave 2
Direction Next Higher Degrees:Black wave 3
Details: blue wave C of Flat pattern in wave 2 in play . Wave Cancel invalid level : 1.30910
The USD/CAD Elliott Wave Analysis for the day chart on 24 October 23, provides insights into the potential price movements of the U.S. Dollar/Canadian Dollar (USD/CAD) currency pair. This analysis is vital for traders seeking to understand market dynamics and identify potential trading opportunities.
The analysis highlights a "Counter Trend" function, indicating that the current price movement is contrary to the prevailing trend. This information suggests that a potential reversal or correction in the market is underway, which is crucial for traders to consider.
The "impulsive" mode suggests that the counter-trend move is strong and significant, implying that it might result in substantial price changes. This is an essential aspect for traders, particularly those interested in short- to medium-term trading opportunities.
The analysis focuses on the "C of flat" structure, a specific phase within the broader market structure. Understanding this wave pattern is crucial for traders, as it can provide insights into potential trend reversals or corrections.
The report states that "blue wave C of the Flat pattern in wave 2 is in play." This indicates the current phase of the market, which is part of a flat pattern within the broader structure. Recognizing this phase is essential for traders to evaluate potential trading opportunities.
The "Wave Cancel invalid level: 1.30910" serves as a critical reference point. It indicates the price level at which the described wave structure would be invalidated, signaling a potential change in market dynamics.
In summary, the USD/CAD Elliott Wave Analysis for 24 October 23, is significant for traders seeking insights into the USD/CAD currency pair. The presence of the blue wave C in the Flat pattern of wave 2 is an essential aspect to watch. Traders should monitor the market closely for potential trading opportunities and be aware of the provided invalidation level to manage risk effectively.
Technical Analyst: Malik Awais
Source: Tradinglounge.com get trial here!