01Mar

Stock Analysis: The Procter & Gamble Company (PG) Elliott Wave Technical Analysis 1 March 24

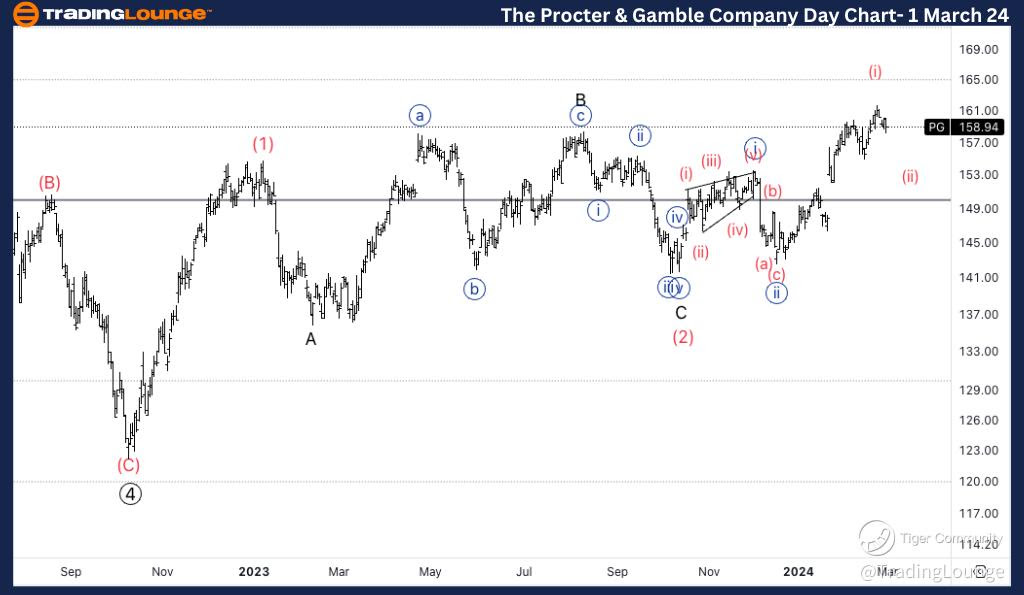
PG Elliott Wave Analysis Trading Lounge Daily Chart, 1 March 24

Welcome to our PG Elliott Wave Analysis Trading Lounge, your ultimate destination for detailed insights into The Procter & Gamble Company (PG) using Elliott Wave Technical Analysis. As of the Daily Chart on 1 March 24, we dive into crucial trends shaping the market.

The Procter & Gamble Company, (PG) Daily Chart Analysis

PG Elliott Wave Technical Analysis

FUNCTION: Trend

MODE: Impulse

STRUCTURE: Motive

POSITION: Minuette wave (ii) of {iii}.

DIRECTION: Bottom in wave (ii).  

DETAILS: As we are approaching ATH at 165$, we are expecting either an acceleration higher into wave (3) or else we could have topped in wave (C) to then fall back lower and continue the major correction.

In terms of wave dynamics, we identify a trend function with an impulse structure, specifically a motive pattern. The current position is in Minuette wave (ii) of {iii}, indicating a potential bottom in wave (ii). With the approaching all-time high (ATH) at $165, we anticipate either an upward acceleration into wave (3) or a potential top in wave (C), followed by a downward movement to continue the major correction.

PG-Day-Stock-Chart-0...


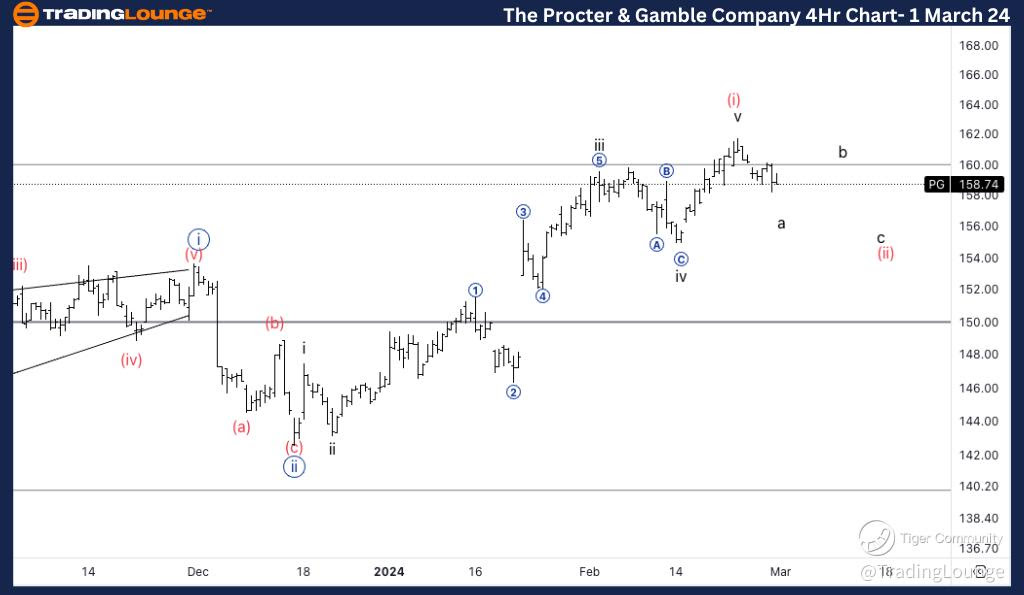
PG Elliott Wave Analysis Trading Lounge 4Hr Chart, 1 March 24

The Procter & Gamble Company, (PG) 4Hr Chart Analysis

PG Elliott Wave Technical Analysis

FUNCTION: Counter Trend

MODE: Corrective

STRUCTURE: Zigzag  

POSITION: Wave a of (ii).  

DIRECTION: Downside into wave (ii).

DETAILS: Looking for a clear three-wave move into wave (ii) to find support around the 155$ mark.  

Here, we explore a counter-trend mode with a corrective structure, specifically a zigzag pattern. The present position is in Wave a of (ii), suggesting downside movement into Wave (ii). We anticipate a clear three-wave move into wave (ii), aiming to find support around the $155 mark.

Technical Analyst: Alessio Barretta

Source: visit Tradinglounge.com and learn From the Experts Join TradingLounge Here 

See Previous: UnitedHealth Group Inc. (UNH)

TradingLounge Once Off SPECIAL DEAL: Here > 1 month Get 3 months.   

PG-4Hr-Stock-Chart-0...

Related

Elliott Wave Analysis Predicts CAR Group Limited Stock Rally, ASX: CAR Technical Forecast with Wave 5 Setup and Key Levels

Elliott Wave Analysis Predicts CAR Group Limited Stock Rally, ASX: CAR Technical Forecast with Wave 5 Setup and Key Levels

CAR Group Limited (ASX: CAR) technical overview provides an in-depth Elliott Wave analysis, covering...

Read More >
Unlocking ASX Trading Success: Woolworths Group Limited (WOW) Stock Analysis & Elliott Wave Technical Forecast

Unlocking ASX Trading Success: Woolworths Group Limited (WOW) Stock Analysis & Elliott Wave Technical Forecast

This article provides an in-depth Elliott Wave analysis of Woolworths Group Limited (WOW) on the ASX...

Read More >
British Pound/U.S.Dollar(GBPUSD) Forex Elliott Wave Technical Analysis: Day and 4-Hour Charts Overview

British Pound/U.S.Dollar(GBPUSD) Forex Elliott Wave Technical Analysis: Day and 4-Hour Charts Overview

This article offers a comprehensive guide to trading the GBP/USD pair using the Elliott Wave theory....

Read More >
AAPL Elliott Wave Analysis: Exploring Market Corrections and Potential Trends - Trading Lounge Insights

AAPL Elliott Wave Analysis: Exploring Market Corrections and Potential Trends - Trading Lounge Insights

Delve into the Elliott Wave Analysis of Apple Inc. (AAPL) with our in-depth technical analysis, exam...

Read More >
The TJX Companies Inc. (TJX) Stocks Elliott Wave Technical Analysis: Elliott Wave Insights and Predictions

The TJX Companies Inc. (TJX) Stocks Elliott Wave Technical Analysis: Elliott Wave Insights and Predictions

Discover an in-depth TJX stock analysis through Elliott Wave Theory, examining both daily and 4-hour...

Read More >
Unlocking ASX Trading Success: V300AEQ ETF UNITS – VAS Stock Analysis & Elliott Wave Technical Forecast

Unlocking ASX Trading Success: V300AEQ ETF UNITS – VAS Stock Analysis & Elliott Wave Technical Forecast

This article offers a detailed Elliott Wave analysis of the ASX V300AEQ ETF (VAS), focusing on curre...

Read More >

$1 for 2 Weeks

then $29 a month!

What a Special Offer!

Trade Recommendations

Unleash the power of deversified trading with our comprehensive portfolio, covering 250+ markets:

  • Stock Trades
  • Crypto Trades
  • Forex Trades
  • Commodity Trades
Elliott Wave Analysis

Gain a competitive edge with expert insights and AI-powered Elliott Wave charting into:

  • Global Indices
  • US Stocks & ASX Stocks
  • Forex & Crypto
  • Commodities
Top-Notch Trading Tools

Equip yourself with the tools of success:

  • Real-time Chat rooms
  • Elliott Wave Algorithm
  • Portfolio tools
  • TradingLevels
  • Screener
  • Trading Game
7 Elliott Wave Analysts

Stay ahead of the market with daily charts and insightful videos
Your secret to strategic trading!

JOIN HERE


Welcome to TradingLounge (ASIC A.R.No. 321187), specialists in trades, trading education and technical analysis, covering stocks, indices, commodities, forex and cryptocurrencies.

When you join TradingLounge you have access to everything we offer, including trade tools, educational content and a social platform to chat with like-minded investors.

Read more

@Copyright 2024 by tradinglounge.com

Contact Us

Australian no: 02 4787 6020

International no: +61 (2) 47876020

Pay with:

Find us on