TradingLounge Cocoa Commodity Elliott Wave Technical Analysis
Function: Counter-trend
Mode: Corrective
Structure: Emerging Zigzag
Position: Navy blue wave ‘c’
Direction: Navy blue wave ‘c’ is still in play
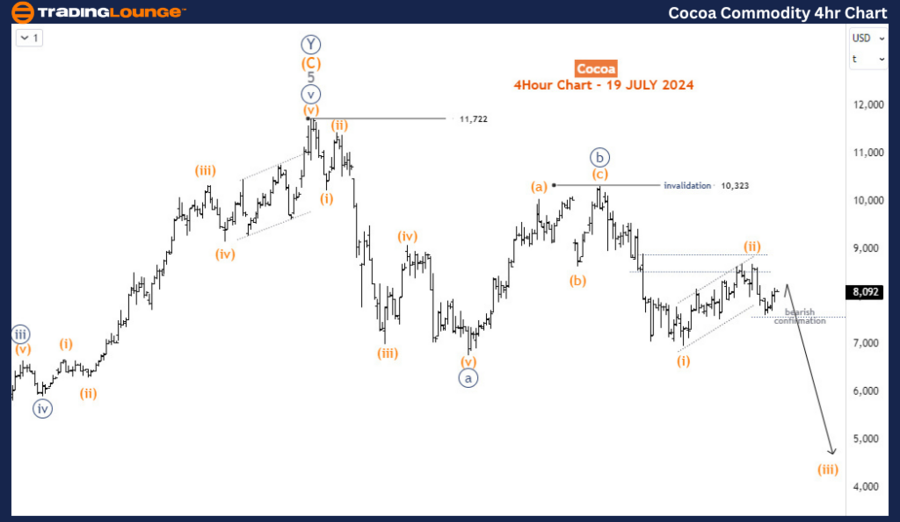
Details: Prices breached 8626 to confirm the progress of wave c (circled). Further sell-off is expected toward 5,000. Wave (ii) appears to be resisted below 9,000. Thus, wave (iii) downside is favored.
Cocoa Elliott Wave Technical Analysis
Current Market Movements
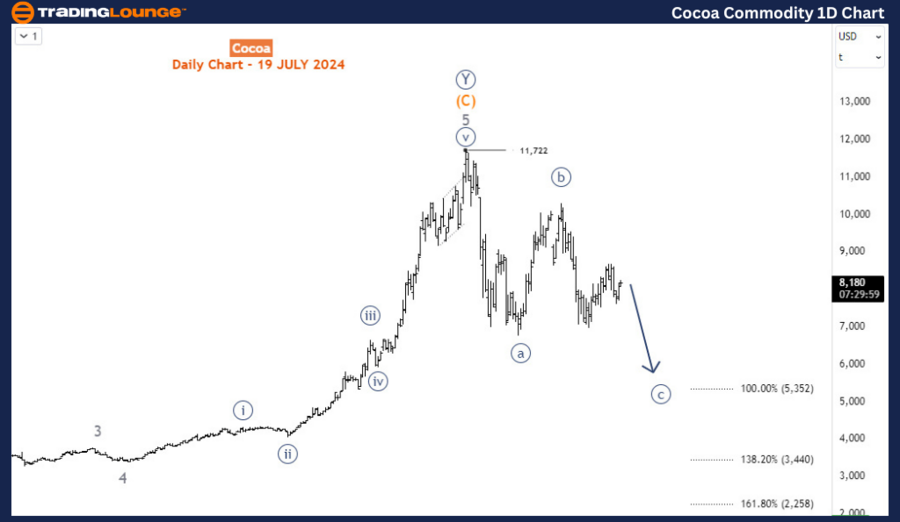
The current movements in the cocoa market illustrate a clear downward trend. Cocoa is approaching the lows seen in May 2024, continuing its fall from the record high reached on April 19, 2024, at 11,722. Since that peak, the commodity has dropped by 30%. This downtrend is anticipated to continue, potentially bringing prices down to the 5,000 mark in the upcoming weeks.
Cocoa Daily Chart Analysis
A close analysis of the daily chart shows that cocoa completed a significant bullish impulse wave cycle starting in September 2022, when prices were around 2,000. By April 2024, this impulse wave had increased prices by over 430%, reaching the all-time high. According to Elliott Wave theory, impulse waves are usually followed by a three-wave corrective structure. The current decline from the all-time high is thus seen as a corrective phase, expected to develop in an a-b-c wave pattern.
In this scenario, waves a and b (circled) have already finished, and the price is currently in wave c. Projections suggest that wave c will likely extend to 5,000 or lower before the bullish trend potentially resumes. This expected decline is consistent with the typical behavior of corrective waves following an impulsive move.

Cocoa H4 Chart Analysis
The H4 chart offers a closer view of the sub-waves within this decline, showing a potential 5-3-5 corrective structure. In this structure, wave c is currently in its 2nd sub-wave, wave (ii), which seems to have completed below the 9,000 mark. The price is expected to break below the 7,000 level to continue its decline towards the 5,000 target. However, any further extension higher for wave (ii) should be limited below the 10,323 high, preserving the integrity of the corrective pattern.
Summary
In summary, the Elliott Wave analysis indicates that cocoa is in the midst of a substantial corrective phase following its all-time high in April 2024. The key levels to monitor include the 9,000 mark, which wave (ii) has already dropped below, and the 7,000 level, which could indicate the continuation of the decline. The ultimate target for wave c is projected around the 5,000 mark, aligning with the typical behavior of corrective waves. This analysis highlights the importance of closely observing wave structures and key price levels to predict future movements in the cocoa market, offering valuable insights for both short-term and long-term trading strategies.
Technical Analyst: Sanmi Adeagbo
Source: visit Tradinglounge.com and learn From the Experts Join TradingLounge Here
See Previous: Natura Gas Elliott Wave Technical Analysis
Special Trial Offer - 0.76 Cents a Day for 3 Months! Click here
Access 7 Analysts Over 170 Markets Covered. Chat Room With Support
