Costco Wholesale Corp., Elliott Wave Technical Analysis
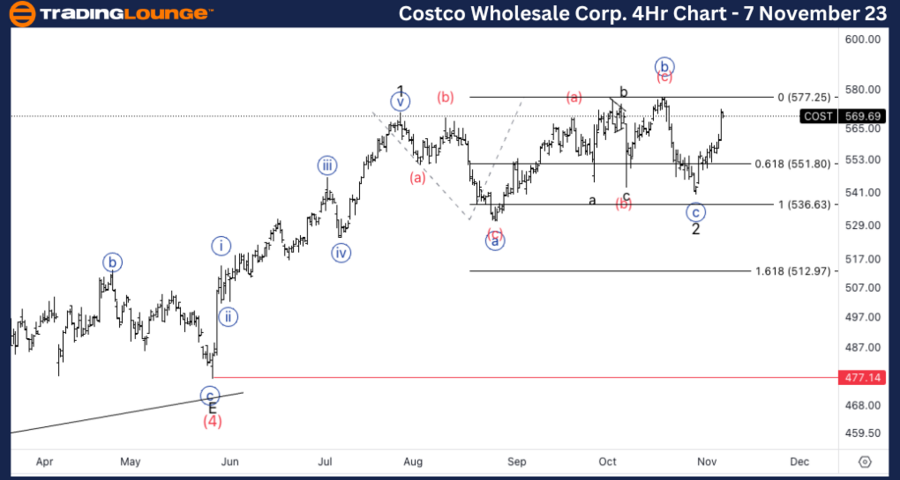
Costco Wholesale Corp., (COST:NASDAQ): 4h Chart 7 November 23
COST Stock Market Analysis: We have been stuck in this correction in wave 2 for a while, as it became a double correction. It looks like we could have found support on 550$ and we are now resuming higher. Invalidation would stand on the bottom of wave 2.
COST Elliott Wave Count: Wave {i} of 3.
COST Technical Indicators: In between averages.
COST Trading Strategy: Looking for upside into wave 3.
TradingLounge Analyst: Alessio Barretta
Source: Tradinglounge.com get trial here!
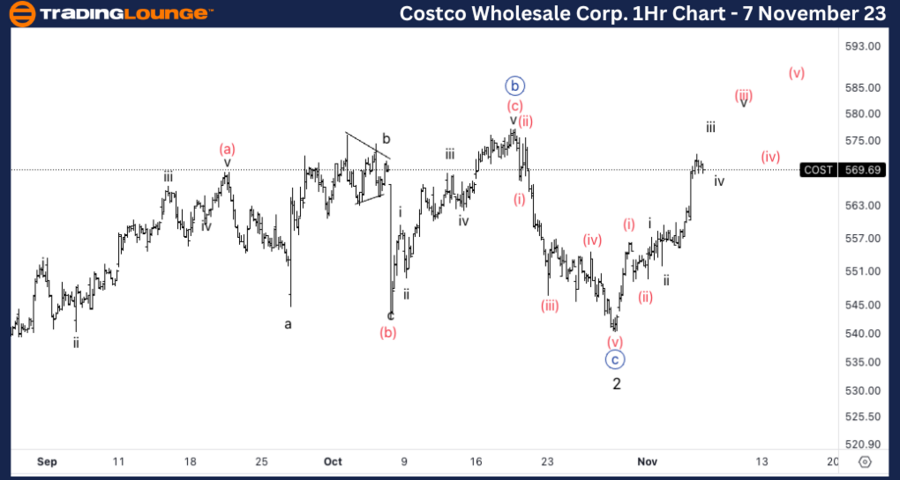
Costco Wholesale Corp., COST: 1-hour Chart 7 November 23
Costco Wholesale Corp., Elliott Wave Technical Analysis
COST Stock Market Analysis: We are looking at wave {i} unfolding to the upside. Given the steepness of the up move, it seems to be trend establishing. Looking for a series of threes and fours.
COST Elliott Wave count: Wave iii of (iii).
COST Technical Indicators: Above all averages, 20 and 200EMA crossed.
COST Trading Strategy: Looking for longs into wave {i}.

NASDAQ-listed stocks, including AAPL, TSLA, AMZN, NVDA, MSFT, Meta Platforms, NFLX, and GOOGL. The a...
Read More >

VeChain trading with expert Elliott Wave analysis and VETUSD insights. Explore technical analysis, p...
Read More >
 Elliott Wave Analysis Predicts $2,478 Target as Wave 3 Begins – ETH Price Forecast and Trading Strategy Included")
Ethereum resumes its bullish trend with wave (3) in play. Elliott Wave analysis shows $2,478 as the ...
Read More >
 Through Market Trends - Forex Elliott Wave Technical Analysis")
This detailed article provides an in-depth Elliott Wave Analysis of the AUDJPY (Australian Dollar/Ja...
Read More >

COMMODITY MARKETS: Bond Yields, USD Dollar DXY, US Gold, Silver, Iron Ore,Copper, Uranium, Oil, Gas
Read More >
 Stocks Elliott Wave Technical Analysis")
This article provides a thorough Elliott Wave analysis for Analog Devices Inc. (ADI), offering insig...
Read More >