25Oct

Elliott Wave Analysis of Fortescue Metals Group: Information to Navigate FMG's Market Movement with Current and Future Stock Trends on the ASX

ASX: FORTESCUE LTD – FMG Elliott Wave Analysis | TradingLounge (1D Chart)

Welcome to our Elliott Wave analysis update for the Australian Stock Exchange (ASX), focusing on FORTESCUE LTD (FMG). Our assessment suggests FMG.ASX may be on the verge of entering a bullish wave ((iii))-navy.

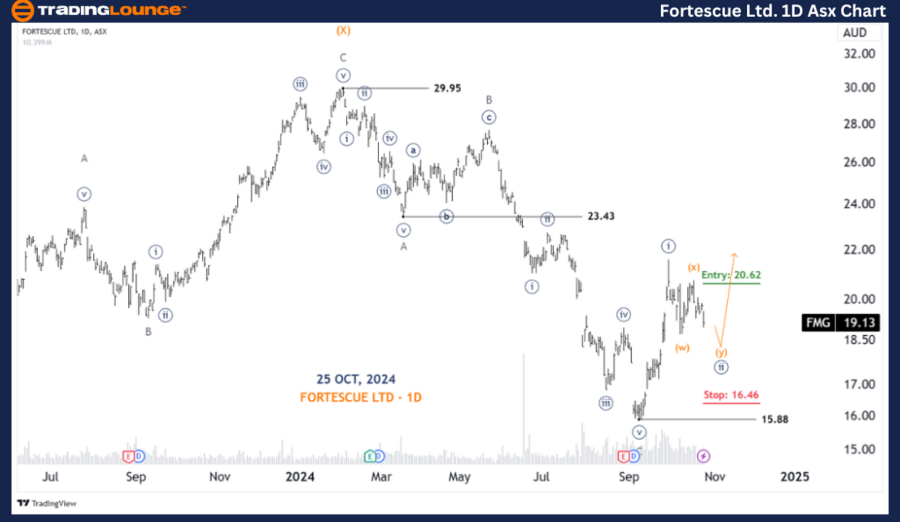
ASX: FORTESCUE LTD – FMG 1D Chart (Semilog Scale) Analysis

FMG Elliott Wave Technical Analysis

Trend Function: Major trend (Minute degree, navy)

Mode: Motive

Structure: Impulse

Position: Wave ((ii))-navy

Wave Details: The current wave ((ii))-navy is extending longer and moving downward more than initially anticipated. A potential rebound in wave ((iii))-navy could increase the price. Our designated stop level remains secure for now.

Invalidation Point: 15.88

Fortescue-Ltd-1D-Asx...


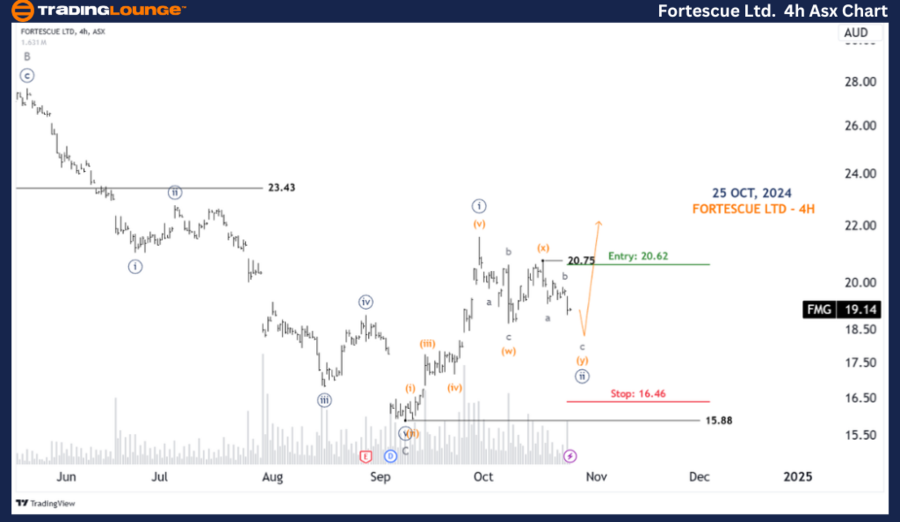
ASX: FORTESCUE LTD – FMG 4-Hour Chart Analysis

Trend Function: Major trend (Minute degree, navy)

Mode: Motive

Structure: Impulse

Position: Wave c-grey of Wave (y)-orange of Wave ((ii))-navy

Wave Details: Since reaching the low at 15.88, wave ((i))-navy completed as a five-wave pattern, while wave ((ii))-navy is moving downward, developing as a Double Zigzag. It appears that wave (w),(x)-orange has completed, and wave (y)-orange will likely continue to push lower. With the stop positioned at 16.46, we expect it to hold steady.

Invalidation Point: 15.88

Technical Analyst: Hua (Shane) Cuong, CEWA-M (Master’s Designation).

Source: visit Tradinglounge.com and learn From the Experts Join TradingLounge Here 

See Previous: LIGHT & WONDER INC Elliott Wave Technical Analysis

VALUE Offer - Buy 1 Month & Get 3 Months!Click here

Access 7 Analysts Over 200 Markets Covered. Chat Room With Support

Fortescue-Ltd-4h-Asx...


Conclusion

This Elliott Wave analysis for ASX: FORTESCUE LTD – FMG highlights both the broader market context and short-term trends to assist readers in leveraging current patterns for informed decision-making. We have identified key price points serving as validation or invalidation markers, increasing the confidence in our market outlook. By combining these components, we aim to offer a balanced and professional view on the emerging market trends for FMG.

Related

Providing Essential Insights: NASDAQ Global Indices Elliott Wave Technical Analysis daily and weekly charts

Providing Essential Insights: NASDAQ Global Indices Elliott Wave Technical Analysis daily and weekly charts

This article provides a comprehensive Elliott Wave Analysis of the NASDAQ Composite and Nasdaq 100, ...

Read More >
Copper Commodity Elliott Wave Technical Analysis : Undergoing a Pullback Within a Larger Bullish Structure

Copper Commodity Elliott Wave Technical Analysis : Undergoing a Pullback Within a Larger Bullish Structure

Copper is undergoing a pullback within a larger bullish Elliott Wave structure that began in July 20...

Read More >
Elliott Wave Analysis of Dow Jones (DJI): Insights on Corrective Phase with Orange Wave B and Navy Blue Wave 4 Trends

Elliott Wave Analysis of Dow Jones (DJI): Insights on Corrective Phase with Orange Wave B and Navy Blue Wave 4 Trends

The Dow Jones Industrial Average (DJI) using Elliott Wave Theory highlights the progression of orang...

Read More >
Bitcoin/U.S. dollar(BTCUSD) Elliott Wave Technical Analysis 17 January 24

Bitcoin/U.S. dollar(BTCUSD) Elliott Wave Technical Analysis 17 January 24

Bitcoin/U.S. dollar(BTCUSD) Elliott Wave Technical Analysis dated 17 January 24 with Bitcoin and U.S...

Read More >
Walmart Stock Analysis: Bullish Wave Setup in WMT Chart Signals Breakout Opportunity Using Elliott Wave Forecast Techniques

Walmart Stock Analysis: Bullish Wave Setup in WMT Chart Signals Breakout Opportunity Using Elliott Wave Forecast Techniques

Walmart stock shows potential bullish continuation as Elliott Wave analysis suggests wave {iv} may b...

Read More >
U.S. Dollar / Japanese Yen (USDJPY) Forex Elliott Wave Technical Analysis Reveals Key Correction and Wave Breakout Setup

U.S. Dollar / Japanese Yen (USDJPY) Forex Elliott Wave Technical Analysis Reveals Key Correction and Wave Breakout Setup

USDJPY shows a corrective wave 2 unfolding in a broader bullish trend. Watch for reversal signals an...

Read More >

$1 for 2 Weeks

then $29 a month!

What a Special Offer!

Trade Recommendations

Unleash the power of deversified trading with our comprehensive portfolio, covering 250+ markets:

  • Stock Trades
  • Crypto Trades
  • Forex Trades
  • Commodity Trades
Elliott Wave Analysis

Gain a competitive edge with expert insights and AI-powered Elliott Wave charting into:

  • Global Indices
  • US Stocks & ASX Stocks
  • Forex & Crypto
  • Commodities
Top-Notch Trading Tools

Equip yourself with the tools of success:

  • Real-time Chat rooms
  • Elliott Wave Algorithm
  • Portfolio tools
  • TradingLevels
  • Screener
  • Trading Game
7 Elliott Wave Analysts

Stay ahead of the market with daily charts and insightful videos
Your secret to strategic trading!

JOIN HERE


Welcome to TradingLounge (ASIC A.R.No. 321187), specialists in trades, trading education and technical analysis, covering stocks, indices, commodities, forex and cryptocurrencies.

When you join TradingLounge you have access to everything we offer, including trade tools, educational content and a social platform to chat with like-minded investors.

Read more

@Copyright 2024 by tradinglounge.com

Contact Us

Australian no: 02 4787 6020

International no: +61 (2) 47876020

Pay with:

Find us on