31Oct

State Bank of India Stocks Elliott Wave Technical Analysis: Interpret Current Trends and Potential Future Price Movements

STATE BANK OF INDIA – SBIN  Elliott Wave Analysis (1D Chart)

SBIN Elliott Wave Technical Analysis

Function: Counter Trend (Minor Degree, Grey)

Mode: Motive

Structure: Impulse within Larger Degree Zigzag

Position: Minor Wave 2

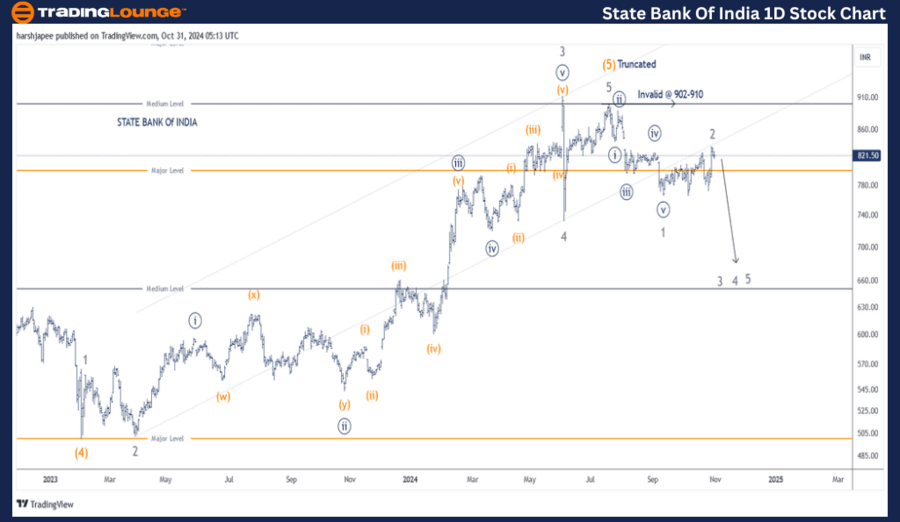
Details: Minor Wave 2 (Grey) may now be complete near the 850 level, aligning with the previous Wave ((iv)) of a lower degree. If this analysis holds, Wave 3 could soon commence.

Invalidation Point: 910

State Bank of India Daily Chart Technical Analysis and Potential Elliott Wave Counts

The daily chart of State Bank of India indicates that the stock might have completed its broader uptrend around the 910 mark, with Intermediate Wave (5) (Orange) potentially truncated. Alternatively, Minor Wave 5 within (5) may be extending or subdividing relative to the 730 low.

In February 2023, State Bank of India completed Intermediate Wave (4) (Orange) near 500. Since then, the chart has displayed Minor Waves 1 (Impulse), 2 (Expanded Flat), 3 (Impulse Extension), 4 (Zigzag, Sharp), and 5 (Truncated), culminating near the 910 high.

Assuming this analysis is accurate, the stock has turned downward from 910, beginning a larger corrective phase. Minor Wave 1 (Impulse) and Minor Wave 2 (Flat) appear completed around the 840-850 range. If this trend continues, Minor Wave 3 could now be in motion.


STATE-BANK-OF-INDIA-...


STATE BANK OF INDIA – SBIN (4H Chart) Elliott Wave Analysis

Function: Counter Trend (Minor Degree, Grey)

Mode: Motive

Structure: Impulse within Larger Degree Zigzag

Position: Minor Wave 2

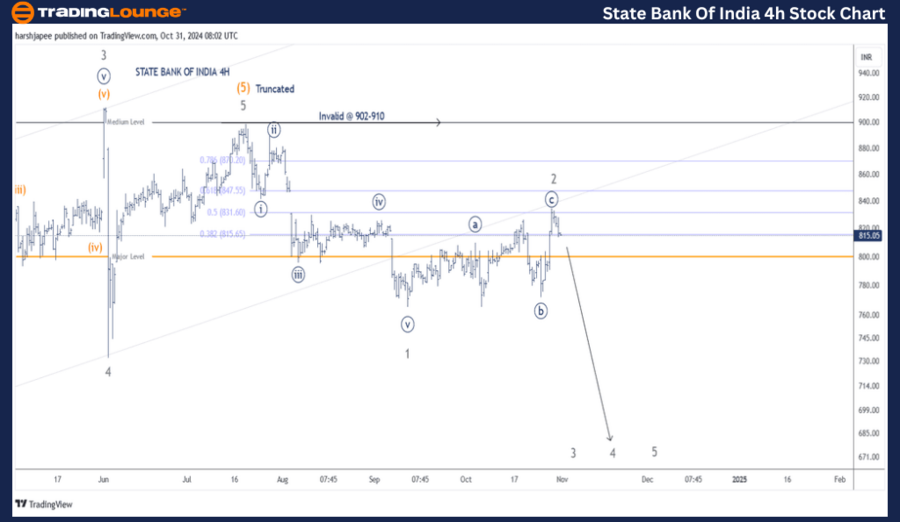
Details: Minor Wave 2 (Grey) seems to have concluded near 850, aligning with the previous Wave ((iv)) of a lesser degree. If this holds true, Wave 3 may soon emerge. The Fibonacci 0.50 retracement of Wave 1 has been tested, leaving room for a potential 0.618 level test before Wave 3 resumes.

Invalidation Point: 910

State Bank of India 4H Chart Technical Analysis and Potential Elliott Wave Counts

The 4H chart of State Bank of India emphasizes the sub-waves following Minor Wave 3’s peak near 910. Minor Wave 4 saw a sharp pullback, ending near 730 on June 4, 2024. Minor Wave 5 potentially displays a truncation around the 900 mark.

If accurate, a larger corrective wave is likely underway, with Minor Waves 1 and 2 now completed near 765 and within the 840-850 range, respectively. Alternatively, Minor Wave 5 may continue to extend, driving prices above the 900 threshold.

Technical Analyst: Harsh Japee

Source: visit Tradinglounge.com and learn From the Experts Join TradingLounge Here 

Previous: Larsen & Toubro Elliott Wave Technical Analysis

VALUE Offer - Buy 1 Month & Get 3 Months!Click here

Access 7 Analysts Over 200 Markets Covered. Chat Room With Support

STATE-BANK-OF-INDIA-...


Conclusion:

State Bank of India is moving lower, with Minor Wave 3 (Grey) expected to continue below the 910 level.

Related

Exxon Mobil Inc.(XOM:NYSE) Elliott Wave Technical Analysis 9 January 24

Exxon Mobil Inc.(XOM:NYSE) Elliott Wave Technical Analysis 9 January 24

Exxon Mobil Corp.(XOM: NYSE) Elliott Wave Technical Analysis dated 4 January 24 with 4-Hour and 1-Ho...

Read More >
Asx Stock's Potential Movement Stay Updated with our NWS Stock Analysis & Elliott Wave Technical Forecast

Asx Stock's Potential Movement Stay Updated with our NWS Stock Analysis & Elliott Wave Technical Forecast

Our detailed Elliott Wave analysis on ASX: News Corporation (NWS) provides a comprehensive outlook o...

Read More >
USDJPY Elliott Wave Technical Analysis Shows U.S. Dollar/Japanese Yen Forex Currency Pair is Currently in a Downward Trend Phase

USDJPY Elliott Wave Technical Analysis Shows U.S. Dollar/Japanese Yen Forex Currency Pair is Currently in a Downward Trend Phase

The USDJPY currency pair is currently in a downward trend phase according to Elliott Wave analysis. ...

Read More >
WTI Crude Oil Price Outlook: Elliott Wave Analysis Predicts $50 Target as Bearish Trend Holds Below $72 Resistance Level

WTI Crude Oil Price Outlook: Elliott Wave Analysis Predicts $50 Target as Bearish Trend Holds Below $72 Resistance Level

WTI crude oil continues a bearish Elliott Wave correction. Resistance at $72 limits gains, with down...

Read More >
Elliott Wave Analysis for ASX Unibail-Rodamco-Westfield: Reveals Bullish Fifth Wave Structure and Medium-Term Stock Forecast

Elliott Wave Analysis for ASX Unibail-Rodamco-Westfield: Reveals Bullish Fifth Wave Structure and Medium-Term Stock Forecast

Elliott Wave analysis reviews URW stock on the ASX, showing medium-term bullish potential. Wave stru...

Read More >
Price Action Wheat Elliott Wave Analysis: Technical insights, forecasts, and trading opportunitie

Price Action Wheat Elliott Wave Analysis: Technical insights, forecasts, and trading opportunitie

Delve into the captivating world of wheat price analysis through Elliott wave theory. This article p...

Read More >

$1 for 2 Weeks

then $29 a month!

What a Special Offer!

Trade Recommendations

Unleash the power of deversified trading with our comprehensive portfolio, covering 250+ markets:

  • Stock Trades
  • Crypto Trades
  • Forex Trades
  • Commodity Trades
Elliott Wave Analysis

Gain a competitive edge with expert insights and AI-powered Elliott Wave charting into:

  • Global Indices
  • US Stocks & ASX Stocks
  • Forex & Crypto
  • Commodities
Top-Notch Trading Tools

Equip yourself with the tools of success:

  • Real-time Chat rooms
  • Elliott Wave Algorithm
  • Portfolio tools
  • TradingLevels
  • Screener
  • Trading Game
7 Elliott Wave Analysts

Stay ahead of the market with daily charts and insightful videos
Your secret to strategic trading!

JOIN HERE


Welcome to TradingLounge (ASIC A.R.No. 321187), specialists in trades, trading education and technical analysis, covering stocks, indices, commodities, forex and cryptocurrencies.

When you join TradingLounge you have access to everything we offer, including trade tools, educational content and a social platform to chat with like-minded investors.

Read more

@Copyright 2024 by tradinglounge.com

Contact Us

Australian no: 02 4787 6020

International no: +61 (2) 47876020

Pay with:

Find us on