30Oct

Larsen & Toubro Stock Elliott Wave Technical Analysis: Covering Current Trends, Wave Counts, and Potential Price targets

LARSEN & TOUBRO – LT Elliott Wave Analysis (1D Chart)

LT Elliott Wave Technical Analysis

Function: Counter Trend (Intermediate degree, orange)

Mode: Corrective

Structure: Impulse, within larger Wave (A)

Position: Minor Wave 3 Grey

Details: Minor Wave 3 Grey is moving lower, positioned against the 3930 mark.

Invalidation Point: 3930

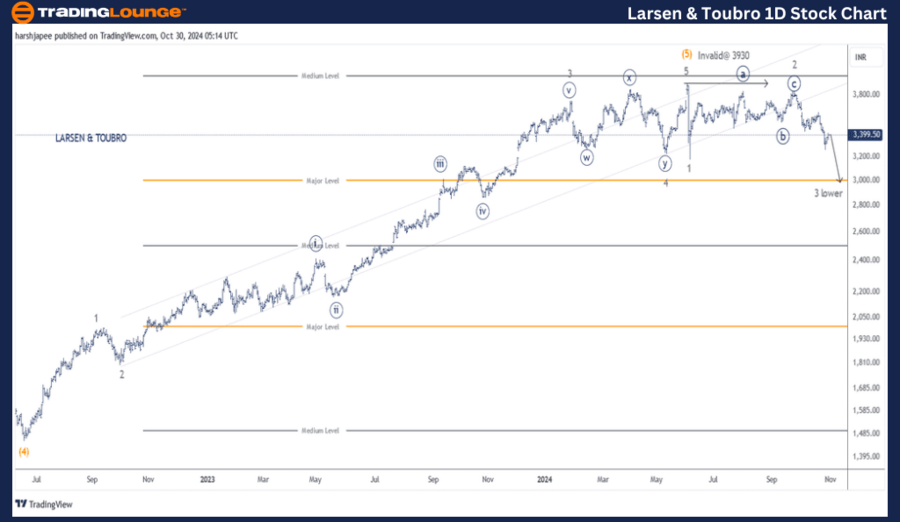
Larsen & Toubro Daily Chart Technical Analysis and Potential Elliott Wave Counts

The daily chart for Larsen & Toubro suggests a developing counter trend at the Minor degree, notably against the 3930 high. The Intermediate Wave (5) in Orange seems to have culminated near the 3930 mark, potentially signaling the end of a multiyear upward movement.

In June 2022, the stock declined to approximately 1450, marking the beginning of Intermediate Wave (5) Orange. Bullish momentum carried the stock upward, resulting in an impulse that peaked around 3930 on June 03, 2024.

From that point, prices started a downtrend, breaking below 3180—marked as Minor Wave 1 in the larger corrective wave. Minor Wave 2 saw a recovery up to 3840, followed by a renewed downturn. A dip beneath the 3180-3190 range could indicate a deeper correction.


Larsen-&-Torbro-1D-S...


LARSEN & TOUBRO – LT (4H Chart) Elliott Wave Technical Analysis

Function: Counter Trend (Intermediate degree, orange)

Mode: Corrective

Structure: Impulse, within larger Wave (A)

Position: Minor Wave 3 Grey

Details: Minor Wave 3 Grey is trending downward against the 3930 high. Ideally, prices should remain below the 3840 level, where Minor Wave 2 terminated.

Invalidation Point: 3930

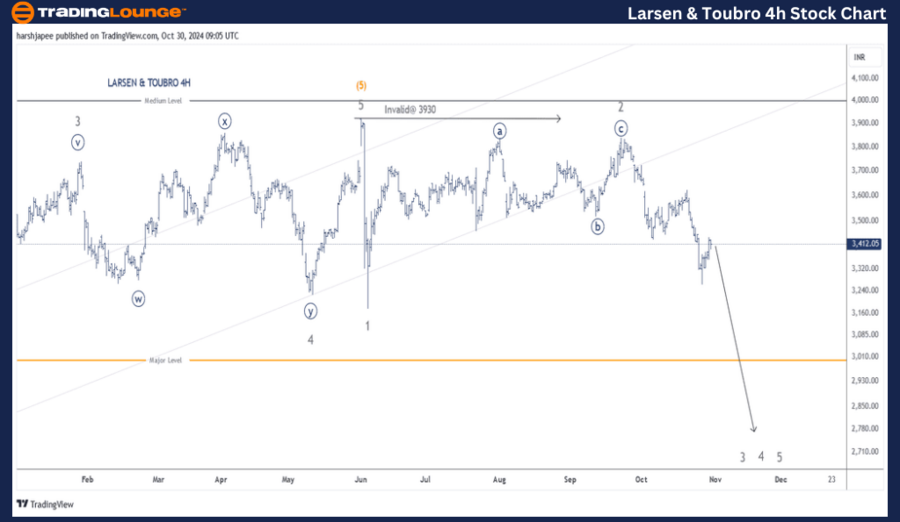
Larsen & Toubro 4H Chart Technical Analysis and Potential Elliott Wave Counts

The 4-hour chart for Larsen & Toubro provides insight into the progression of sub-waves within Minor Wave 3 Grey, which reached near the 3750 mark before a retracement. Minor Wave 4 Grey completed as a combination pattern, while Minor Wave 5 was relatively shallow, terminating around 3930. From this point, a larger corrective wave has likely begun, with Minor Wave 1 and 2 forming near 3200 and 3840, respectively. Minor Wave 3 continues moving lower.

Technical Analyst: Harsh Japee

Source: visit Tradinglounge.com and learn From the Experts Join TradingLounge Here 

Previous: HDFC Life Insurance Elliott Wave Technical Analysis

VALUE Offer - Buy 1 Month & Get 3 Months!Click here

Access 7 Analysts Over 200 Markets Covered. Chat Room With Support

Larsen-&-Torbro-4h-S...


Conclusion:

Larsen & Toubro is currently in a downward trend within Minor Wave 3 Grey, positioned below the 3930 high.

Related

Palo Alto Networks (PANW) Elliott Wave Technical  Analysis: Key Stock Predictions & Future Trends

Palo Alto Networks (PANW) Elliott Wave Technical Analysis: Key Stock Predictions & Future Trends

This article provides an in-depth Elliott Wave analysis of Palo Alto Networks (PANW) stock. Covering...

Read More >
Elliott Wave Analysis for DOTUSD: Technical Insights, Trading Strategies, and Bullish Trend Forecast

Elliott Wave Analysis for DOTUSD: Technical Insights, Trading Strategies, and Bullish Trend Forecast

This article provides an in-depth Elliott Wave Analysis for DOT/USD (DOTUSD), highlighting price pre...

Read More >
Natural Gas Elliott Wave Technical Analysis 12 February 24 Market Trends, Trading Strategies

Natural Gas Elliott Wave Technical Analysis 12 February 24 Market Trends, Trading Strategies

In this comprehensive Natural Gas Elliott Wave Analysis for February 12, traders gain valuable insig...

Read More >
Eli Lilly & Co., (LLY) Elliott Wave Technical Analysis 31 January 24

Eli Lilly & Co., (LLY) Elliott Wave Technical Analysis 31 January 24

Trading Lounge Day and 4Hr Chart for Eli Lilly & Co., (LLY) Elliott Wave Technical Analysis dated 31...

Read More >
WTI Price Predictions, and Trading Strategies to navigate the oil Market effectively: Crudeoil Commodity Elliott Wave Technical Analysis

WTI Price Predictions, and Trading Strategies to navigate the oil Market effectively: Crudeoil Commodity Elliott Wave Technical Analysis

Discover the comprehensive analysis of WTI crude oil with our Elliott Wave technical forecast. Under...

Read More >

Buy 1 Month

Get 3 Months!

Special Offer:

Trade Recommendations

Unleash the power of deversified trading with our comprehensive portfolio, covering:

  • Stock Trades
  • Crypto Trades
  • Forex Trades
  • Commodity Trades
Elliott Wave Analysis

Gain a competive edge with expert insights in to:

  • Global Indices
  • US Stocks & ASX Stocks
  • Forex & Crypto
  • Commodities
Top-Notch Trading Tools

Equip yourself with the tools of success:

  • Social Chat
  • Elliott Wave Algorithm
  • Screener
  • TradingLevels
  • Trading Game
7 Elliott Wave Analysts

Stay ahead of the market with daily charts and insightful videos
-Your secret to strategic trading!

JOIN HERE


Welcome to TradingLounge (ASIC A.R.No. 321187), specialists in trades, trading education and technical analysis, covering stocks, indices, commodities, forex and cryptocurrencies.

When you join TradingLounge you have access to everything we offer, including trade tools, educational content and a social platform to chat with like-minded investors.

Read more

@Copyright 2024 by tradinglounge.com

Contact Us

Australian no: 02 4787 6020

International no: +61 (2) 47876020

Pay with:

Find us on