29Oct

HDFC Life Insurance’s Stocks Forecast And Elliott Wave Technical Analysis - Price Movements and Projected Resistance Levels

HDFC LIFE INSURANCE – HDFCLIFE (1D Chart) Elliott Wave Analysis

HDFC LIFE INSURANCE – HDFCLIFE Elliott Wave Technical Analysis

Trend: Upward Momentum (Intermediate Wave (3), Orange)

Wave Mode: Motive

Wave Structure: Impulse

Current Position: Minute Wave ((v)) Navy

Analysis:
The current Minute Wave ((v)) Navy is advancing within Minor Wave 3 Grey, which forms part of the larger Intermediate Wave (3) Orange. The next potential upside target for this wave is 797. No adjustments to the analysis are required at this stage.

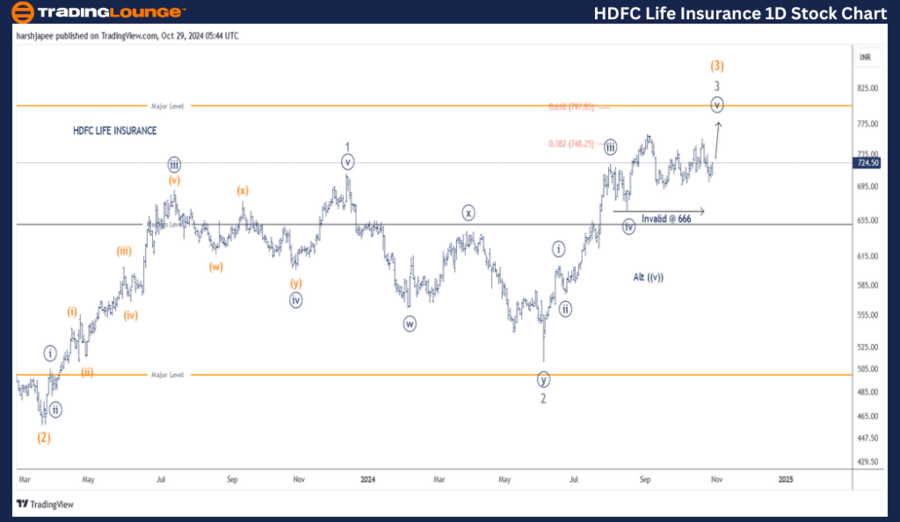
HDFC Life Insurance Daily Chart Analysis with Elliott Wave Counts

HDFC Life Insurance’s daily chart suggests a rally towards the 797 level in the near term, as Minute Wave ((v)) within Minor Wave 3 of Intermediate Wave (3) advances above the 666 support level. A break below this support would validate an alternate wave count, where Minute Wave ((v)) potentially completed around 765.

The stock formed a significant low at approximately 455 in March 2023, marking the end of Intermediate Wave (2) Orange on the daily chart. Following this, Minor Wave 1 Grey peaked near 711, while Minor Wave 2 developed as a complex correction ((w))-((x))-((y)), ending around the 510 level.

Currently, Minor Wave 3 is advancing from the 510 support, with Minute Waves ((i)) through ((iv)) completed. If the count is accurate, Minute Wave ((v)) is moving towards 797 with a key support level at 666.

HDFC-Life-Insurance-...


HDFC LIFE INSURANCE – HDFCLIFE Elliott Wave Analysis (4H Chart)

Trend: Continuing Upward Momentum (Intermediate Wave (3), Orange)

Wave Mode: Motive

Wave Structure: Impulse

Current Position: Minute Wave ((v)) Navy

Analysis:
The 4-hour chart shows Minute Wave ((v)) Navy rising within Minor Wave 3 Grey of the larger Intermediate Wave (3) Orange. The primary upside target remains 797. A drop below 666, however, could indicate that Minute Wave ((v)) concluded around the 760-765 range.

Invalidation Level: 666, with risk tightened to this level.

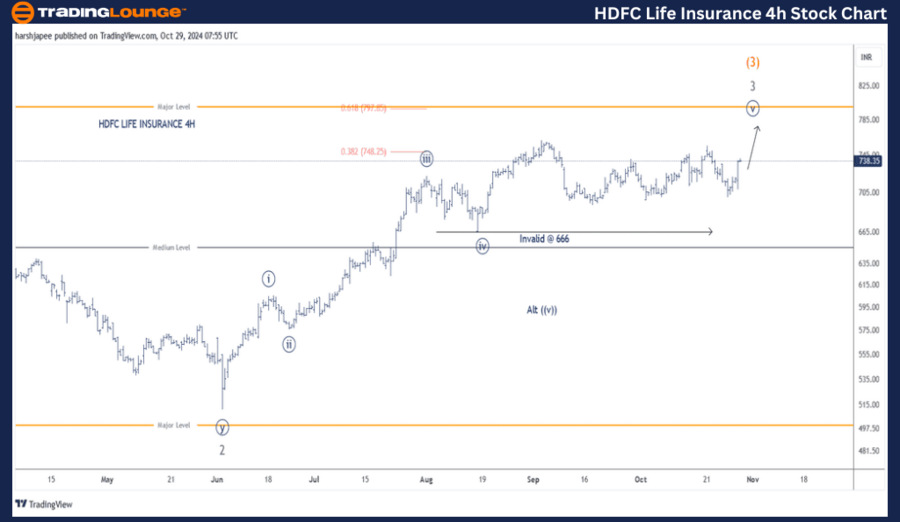
HDFC Life Insurance 4H Chart Analysis and Elliott Wave Counts

On the 4-hour chart, HDFC Life Insurance highlights sub-waves following the completion of Minor Wave 2 Grey at approximately 510 on June 4, 2024. Minute Waves ((i)) through ((iv)) appear complete, with Wave ((v)) advancing towards the 797 level, aligning with the Fibonacci 0.618 extension.

Technical Analyst: Harsh Japee

Source: visit Tradinglounge.com and learn From the Experts Join TradingLounge Here 

Previous: AXIS Bank Elliott Wave Technical Analysis

VALUE Offer - Buy 1 Month & Get 3 Months!Click here

Access 7 Analysts Over 200 Markets Covered. Chat Room With Support

HDFC-Life-Insurance-...


Conclusion

HDFC Life Insurance is anticipated to rise toward 797 as Minute Wave ((v)) extends within Minor Wave 3 Grey of Intermediate Wave (3) Orange.

Related

Australian Dollar/U.S. Dollar (AUDUSD) Elliott Wave Analysis for Daily and 4-Hour Charts Featuring Forecast, and Key Technical Levels

Australian Dollar/U.S. Dollar (AUDUSD) Elliott Wave Analysis for Daily and 4-Hour Charts Featuring Forecast, and Key Technical Levels

AUDUSD Elliott Wave technical analysis provides a detailed breakdown of the current wave structure o...

Read More >
NASDAQ Elliott Wave Analysis: Key Strategies for Trading Apple, Nvidia, and More

NASDAQ Elliott Wave Analysis: Key Strategies for Trading Apple, Nvidia, and More

The summary focuses on Elliott Wave Analysis applied to various NASDAQ stocks including Microsoft, A...

Read More >
XRP Crypto Price News Today Elliott Wave Technical Analysis: XRP's Current Downtrend and Bear Momentum

XRP Crypto Price News Today Elliott Wave Technical Analysis: XRP's Current Downtrend and Bear Momentum

This analysis dives into XRPUSD Elliott Wave patterns, exploring key trends, price predictions, and ...

Read More >
Stocks Bullish Trend: NASDAQ, AAPL, AMZN, NVDA, TSLA, GOOGL, META, NFLX, MSFT, Elliott Wave Analysis

Stocks Bullish Trend: NASDAQ, AAPL, AMZN, NVDA, TSLA, GOOGL, META, NFLX, MSFT, Elliott Wave Analysis

NASDAQ Stock Market Elliott Wave Analysis and Trading Strategies Our Elliott Wave analysis covers t...

Read More >
Gold (XAUUSD) Elliott Wave Technical Analysis: Navigating Waves and Patterns for Market Insight

Gold (XAUUSD) Elliott Wave Technical Analysis: Navigating Waves and Patterns for Market Insight

In the intricate world of Elliott Wave analysis, the current outlook for gold suggests a zigzag patt...

Read More >

Buy 1 Month

Get 3 Months!

Special Offer:

Trade Recommendations

Unleash the power of deversified trading with our comprehensive portfolio, covering:

  • Stock Trades
  • Crypto Trades
  • Forex Trades
  • Commodity Trades
Elliott Wave Analysis

Gain a competive edge with expert insights in to:

  • Global Indices
  • US Stocks & ASX Stocks
  • Forex & Crypto
  • Commodities
Top-Notch Trading Tools

Equip yourself with the tools of success:

  • Social Chat
  • Elliott Wave Algorithm
  • Screener
  • TradingLevels
  • Trading Game
7 Elliott Wave Analysts

Stay ahead of the market with daily charts and insightful videos
-Your secret to strategic trading!

JOIN HERE


Welcome to TradingLounge (ASIC A.R.No. 321187), specialists in trades, trading education and technical analysis, covering stocks, indices, commodities, forex and cryptocurrencies.

When you join TradingLounge you have access to everything we offer, including trade tools, educational content and a social platform to chat with like-minded investors.

Read more

@Copyright 2024 by tradinglounge.com

Contact Us

Australian no: 02 4787 6020

International no: +61 (2) 47876020

Pay with:

Find us on