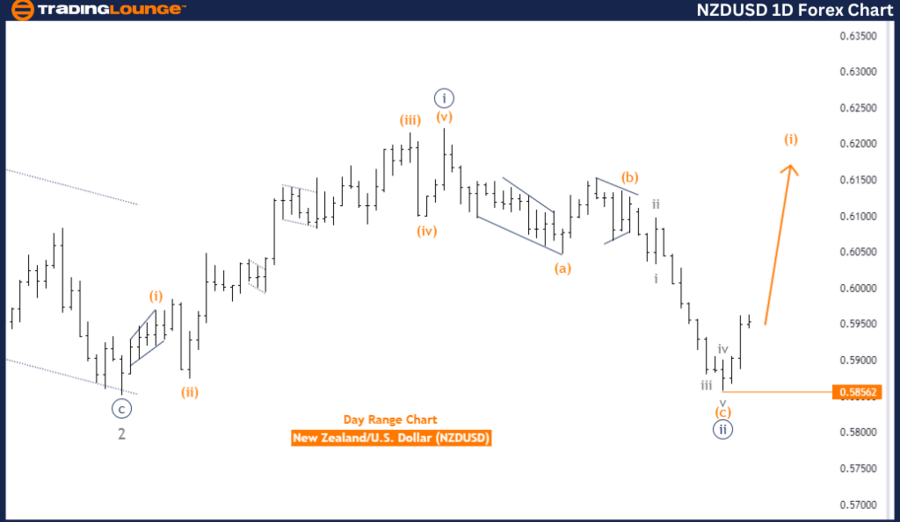
NZDUSD Elliott Wave Analysis - Daily Chart Overview
New Zealand Dollar/U.S. Dollar (NZDUSD) Daily Chart Analysis
NZDUSD Elliott Wave Technical Analysis
Function: Trend
Mode: Impulsive
Structure: Orange wave 1
Position: Navy Blue Wave 3
Next Higher Degree Direction: Orange wave 1 (initiated)
Details: Orange wave C of 2 appears completed; now, orange wave 1 of 3 is in progress.
Wave Cancel Invalid Level: 0.58562
The Elliott Wave analysis for NZDUSD on the daily chart showcases an impulsive trend structure. Currently, orange wave 1 is developing within the broader navy blue wave 3, indicating a potential upward momentum in the market as part of a larger impulsive wave pattern.
Technical indicators suggest the completion of orange wave C of 2, marking the end of a corrective phase and the onset of orange wave 1 of 3. This transition from a corrective to an impulsive phase indicates an upward movement in progress.
The analysis for higher degrees points to orange wave 1, highlighting the early phase of a significant impulsive wave. The market is likely to continue its upward trend, progressing through subsequent waves of the impulsive sequence.
The wave cancel invalid level at 0.58562 serves as a key threshold for the current wave count. A decline below this level would invalidate the present wave structure, necessitating a reevaluation of the wave count and the overall market outlook.
In conclusion, the NZDUSD Elliott Wave Analysis on the daily chart indicates an early stage of a new impulsive upward trend within orange wave 1, positioned in navy blue wave 3. The end of orange wave C of 2 signifies a shift from a corrective phase to an impulsive phase, with orange wave 1 of 3 now active. The critical wave cancel invalid level of 0.58562 must be watched closely for any breaches that would require reassessment.
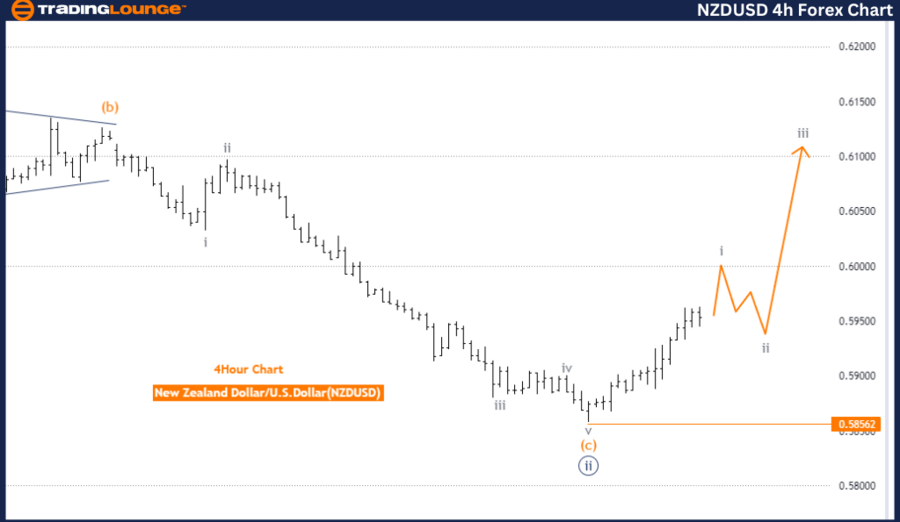
NZDUSD Elliott Wave Analysis - 4-Hour Chart Overview
New Zealand Dollar/U.S. Dollar (NZDUSD) 4 Hour Chart Analysis
NZDUSD Elliott Wave Technical Analysis
Function: Trend
Mode: Impulsive
Structure: Gray wave 1
Position: Orange wave 1
Next Lower Degree Direction: Orange wave 2
Details: Orange wave C of 2 appears completed; now gray wave 1 of 1 is in progress.
Wave Cancel Invalid Level: 0.58562
The Elliott Wave analysis for NZDUSD on the 4-hour chart indicates an impulsive trend structure. The current configuration places gray wave 1 within orange wave 1, suggesting the initiation of a new upward trend with notable price movements.
Technical analysis points to the completion of orange wave C of 2, ending the corrective phase characterized by orange wave C. The market is now transitioning into gray wave 1 of 1, signaling the start of a new impulsive wave with potential upward momentum.
The direction for the next lower degrees is indicated as orange wave 2. Following the completion of gray wave 1, a corrective phase marked by orange wave 2 is anticipated. This phase may involve a temporary pullback or consolidation before the market resumes its primary upward trajectory. The presence of orange wave 2 indicates potential short-term fluctuations before continuing the overall upward trend.
The wave cancel invalid level at 0.58562 is crucial for the current wave analysis. A decline below this level would invalidate the existing wave count, requiring a reassessment of the wave structure and overall market perspective.
In summary, the NZDUSD Elliott Wave Analysis on the 4-hour chart indicates the early stages of a new impulsive upward trend within gray wave 1, positioned in orange wave 1. The analysis suggests that orange wave C of 2 has concluded, and gray wave 1 of 1 is currently unfolding, with orange wave 2 expected to follow. The wave cancel invalid level of 0.58562 is a critical point for validating the current wave structure and requires careful monitoring for any potential breaches.
Technical Analyst: Malik Awais
Source: visit Tradinglounge.com and learn From the Experts Join TradingLounge Here
Previous: EURUSD Elliott Wave Technical Analysis
Special Trial Offer - 0.76 Cents a Day for 3 Months! Click here
Access 7 Analysts Over 170 Markets Covered. Chat Room With Support