14Jan

Silver (XAGUSD) Elliott Wave Analysis: Price Forecast, Technical Trends, Market Outlook, and Trading Insights for January 2025

Silver Elliott Wave Analysis

Silver continues its upward movement, but the price action remains within a bearish correction phase from October 2024. This pullback is adjusting the upward momentum seen since August 2024, or possibly the entire bullish trend of 2024 if it deepens further. Once this correction concludes, the broader bullish trend is anticipated to resume. However, current price action indicates that the October pullback is not yet complete.

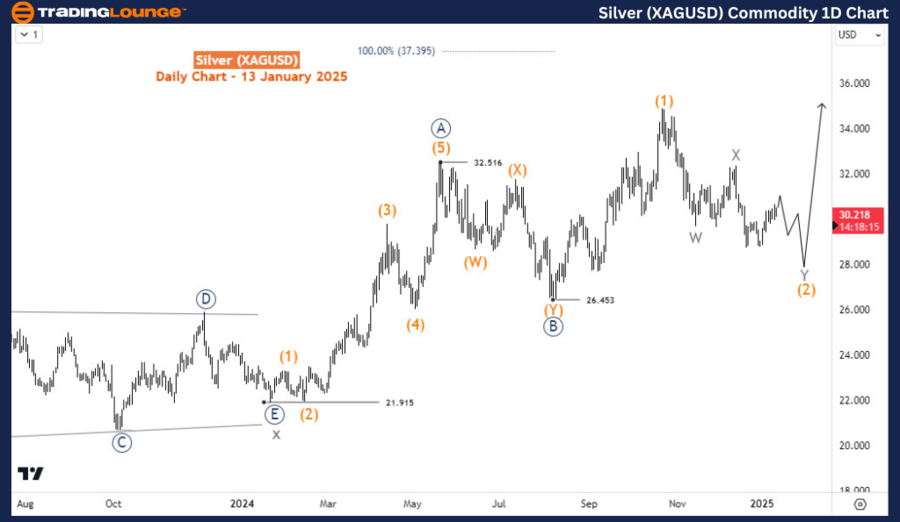
Silver Daily Chart Analysis

On the daily timeframe, Silver remains within a bullish cycle that began in March 2020, when prices were as low as $11.65. From that bottom, Silver has completed at least five swings over 4.5 years, forming what appears to be a large corrective or diagonal pattern. In the short term, the market is retracing the bullish rally. This pullback seems to be forming an incomplete double zigzag pattern, identified as wave (2), assuming it corrects the five-wave rally that began at the August low of $26.453. Wave (2) appears to be unfolding as a complex double zigzag structure.

Silver-Commodity-1d-...


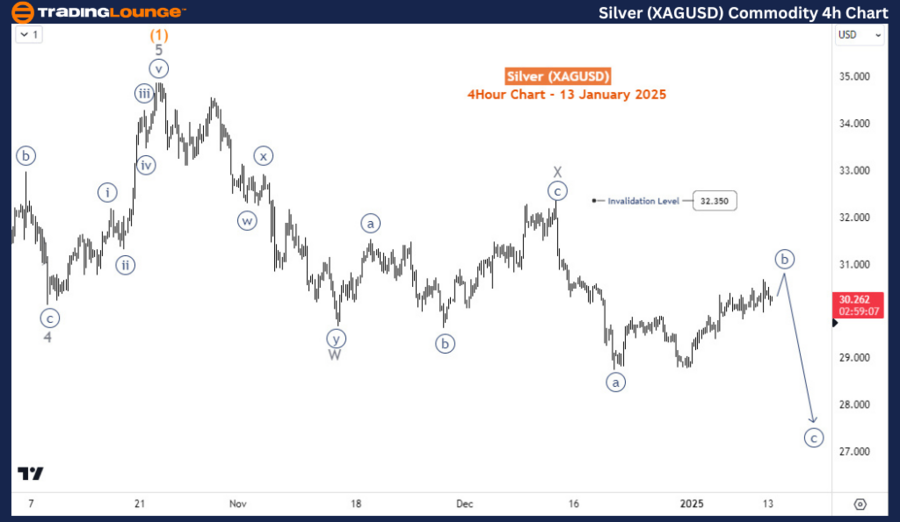
Silver H4 Chart Analysis

On the H4 chart, the internal structure of wave (2)'s double zigzag correction is more evident. Waves W and X of (2) were completed in November and December 2024, respectively. Wave Y initiated at $32.35 and is expected to form a three-wave decline. The recent bounce from the December 19 low is likely wave ((b)). If wave ((b)) remains below $32.35, the price is anticipated to turn lower for wave ((c)) of Y, potentially targeting the $27 level. However, wave (2) should complete above $26.45 to signal the start of a larger bullish trend in wave 3. Should Silver fall below $26.45, it could imply that the commodity is correcting the entire bullish trend from 2024, opening the possibility of further downside.

Technical Analyst: Sanmi Adeagbo

Source: visit Tradinglounge.com and learn From the Experts Join TradingLounge Here 

See Previous: Cocoa Elliott Wave Technical Analysis

VALUE Offer - Buy 1 Month & Get 3 Months!Click here

Access 7 Analysts Over 200 Markets Covered. Chat Room With Support

Silver-Commodity-4h-...

Related

Bitcoin Elliott Wave Analysis: BTC/USD Price Forecast, Support & Resistance Levels, and Key Market Trends for Traders

Bitcoin Elliott Wave Analysis: BTC/USD Price Forecast, Support & Resistance Levels, and Key Market Trends for Traders

This Elliott Wave analysis of BTC/USD provides insights into Bitcoin’s current trend, price targets...

Read More >
Elliott Wave Technical Analysis of Bovespa Index: Bullish Trends, Key Levels, Wave Structures, and Insights for Traders’ Market Gains.

Elliott Wave Technical Analysis of Bovespa Index: Bullish Trends, Key Levels, Wave Structures, and Insights for Traders’ Market Gains.

This article provides an in-depth Elliott Wave analysis of the Bovespa Index, showcasing a bullish t...

Read More >
Most Accurate Silver Price Forecast Using Detailed Elliott Wave analysis: Silver (XAGUSD) Commodity Market Outlook

Most Accurate Silver Price Forecast Using Detailed Elliott Wave analysis: Silver (XAGUSD) Commodity Market Outlook

Stay updated with the most accurate Silver price forecast using detailed Elliott Wave analysis. This...

Read More >
Silver XAGUSD Commodity Elliott Wave Analysis: Forecasting Price Movements and Trading Opportunities in 2024

Silver XAGUSD Commodity Elliott Wave Analysis: Forecasting Price Movements and Trading Opportunities in 2024

Elliott Wave analysis of Silver, focusing on its market trends starting from early 2024. We discuss ...

Read More >
U.S. Dollar / Swiss Franc Forex Currency Pair is Currently in a Corrective Phase - USDCHF Elliott Wave Technical Analysis

U.S. Dollar / Swiss Franc Forex Currency Pair is Currently in a Corrective Phase - USDCHF Elliott Wave Technical Analysis

According to Elliott Wave analysis, the USDCHF is currently in a corrective phase. Orange Wave 2 is ...

Read More >
NJ Elliott Wave Technical Analysis Trading Lounge: Daily and 4-Hour Charts for Johnson & Johnson (JNJ) Stock

NJ Elliott Wave Technical Analysis Trading Lounge: Daily and 4-Hour Charts for Johnson & Johnson (JNJ) Stock

This article provides a detailed Elliott Wave analysis of Johnson & Johnson (JNJ), examining potenti...

Read More >

Buy 1 Month

Get 3 Months!

Special Offer:

Trade Recommendations

Unleash the power of deversified trading with our comprehensive portfolio, covering:

  • Stock Trades
  • Crypto Trades
  • Forex Trades
  • Commodity Trades
Elliott Wave Analysis

Gain a competive edge with expert insights in to:

  • Global Indices
  • US Stocks & ASX Stocks
  • Forex & Crypto
  • Commodities
Top-Notch Trading Tools

Equip yourself with the tools of success:

  • Social Chat
  • Elliott Wave Algorithm
  • Screener
  • TradingLevels
  • Trading Game
7 Elliott Wave Analysts

Stay ahead of the market with daily charts and insightful videos
-Your secret to strategic trading!

JOIN HERE


Welcome to TradingLounge (ASIC A.R.No. 321187), specialists in trades, trading education and technical analysis, covering stocks, indices, commodities, forex and cryptocurrencies.

When you join TradingLounge you have access to everything we offer, including trade tools, educational content and a social platform to chat with like-minded investors.

Read more

@Copyright 2024 by tradinglounge.com

Contact Us

Australian no: 02 4787 6020

International no: +61 (2) 47876020

Pay with:

Find us on