Cocoa Elliott Wave Analysis
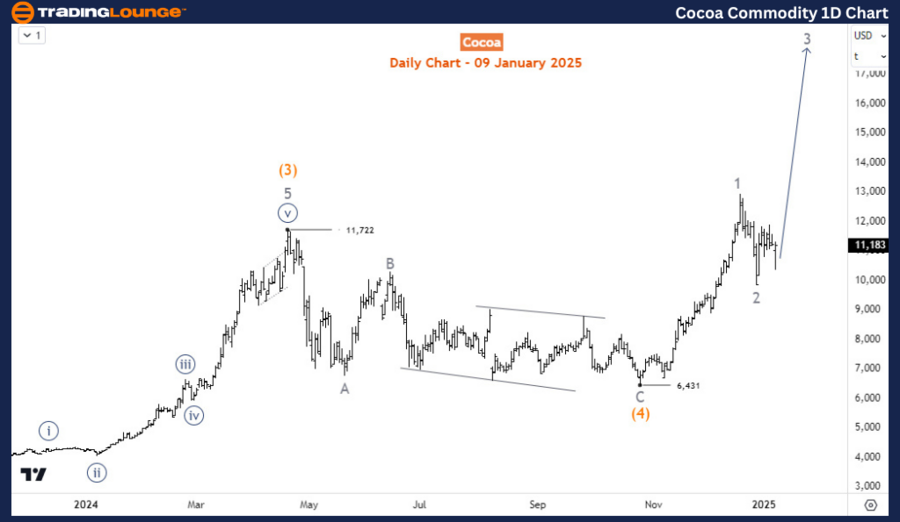
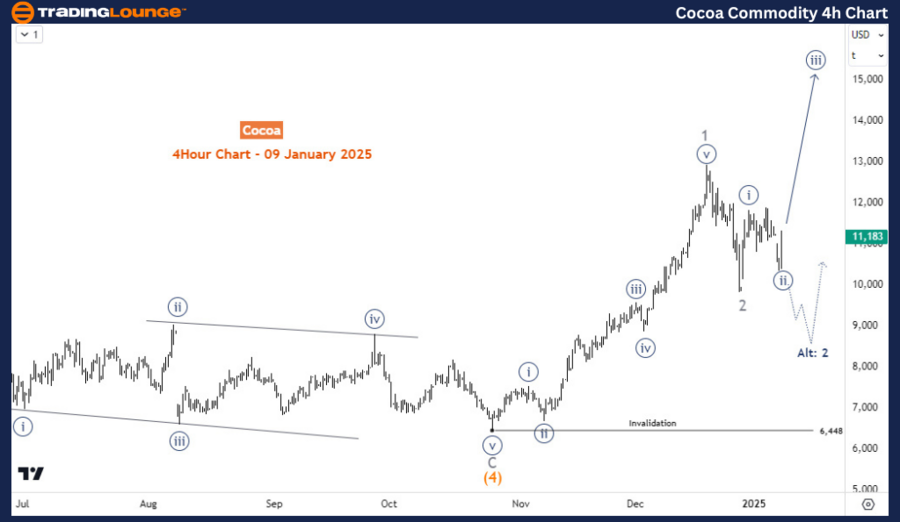
After reaching a record high in December 2024, Cocoa prices began correcting their upward movement from the October low. The recent pullback from the high appears to be complete or nearing completion, signaling the possibility of a new record high.
Cocoa Daily Chart Analysis
Cocoa prices have shown consistent bullish momentum since bottoming at $708 in December 2000. This marked the end of a bearish cycle and initiated a bullish impulse structure. The commodity completed wave I at 3775 in February 2011, followed by a corrective wave II in April 2017 at 1756. Subsequently, wave III surged, breaking the previous high of 3775 to set a new record at 11722 in April 2024, completing wave (3) of ((3)) of III. The corrective wave (4) that followed ended in a zigzag pattern at 6425 in October 2024. Since then, the resurgence in Cocoa prices has been strong, favoring continued upside as buyers seek to capitalize on pullbacks toward new highs.

Cocoa H4 Chart Analysis
On the H4 timeframe, Cocoa has completed a 5-wave rally marking wave 1 of (5). The ongoing pullback from December aligns with wave 2. If prices reclaim the wave 1 high, wave 3 could extend toward 20,000. However, if wave 2 forms a double zigzag, it could target the range of 8742–6795 before resuming the upward trajectory in wave 3. As long as the price does not breach 625, the bullish trend remains intact, and a new record high could be imminent.
Technical Analyst: Sanmi Adeagbo
Source: visit Tradinglounge.com and learn From the Experts Join TradingLounge Here
See Previous: WTI Crude Oil Elliott Wave Technical Analysis
VALUE Offer - Buy 1 Month & Get 3 Months!Click here
Access 7 Analysts Over 200 Markets Covered. Chat Room With Support
