WTI Crude Oil Elliott Wave Analysis
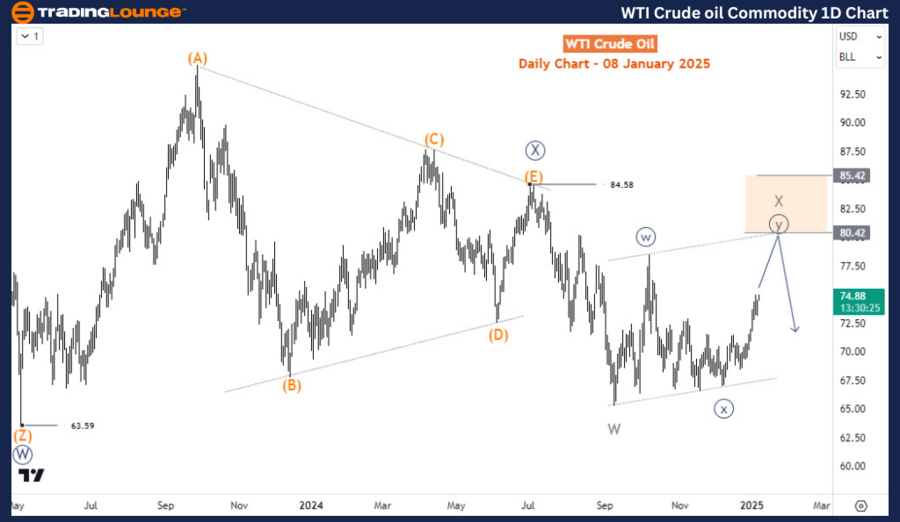
WTI is experiencing a minor recovery since September and might approach the $80 level in the coming days. However, if the rally fails to break above $84.5, the high from July 2024, the bullish momentum is expected to fade, leading to a potential sell-off.
WTI Crude Oil Daily Chart Analysis
WTI remains within a corrective bearish wave sequence that began in March 2022, marking the peak of a 16-year cycle. On the daily chart, this corrective sequence unfolds as a double zigzag structure:
- Wave ((W)) concluded in May 2023.
- This was followed by a choppy bounce forming a triangle structure, labeled as wave ((X)), which ended at $84.58 in July 2024.
Since then, wave ((Y)) has developed to the downside. Within this structure:
- Wave W of (W) of ((Y)) ended at $65.25 in September 2024.
- Wave X emerged as a double zigzag, with waves ((w)) and ((x)) of Y completing in October 2024 and December 2024, respectively.
Currently, WTI is surging from $67, targeting the $80 mark to complete wave X. Once wave X concludes, the price is expected to reverse downward.
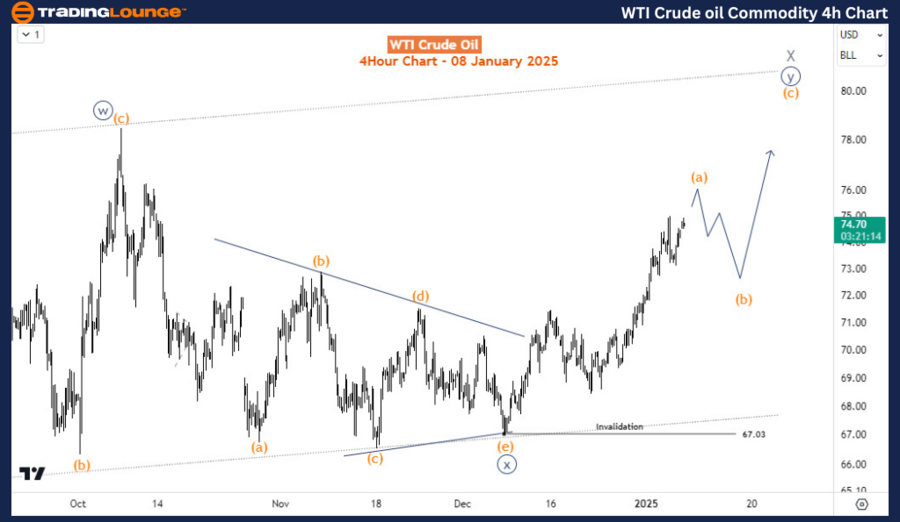
WTI Crude Oil H4 Chart Analysis
On the H4 chart, WTI is nearing the completion of wave (a) of ((y)) of X, which exhibits an impulsive structure. A pullback labeled wave (b) is anticipated shortly.
Key levels to watch:
- Wave (b) is expected to hold above $67 during the pullback.
- Following this, prices are projected to rise toward $80, completing wave X.
Technical Analyst: Sanmi Adeagbo
Source: visit Tradinglounge.com and learn From the Experts Join TradingLounge Here
See Previous: Gold Elliott Wave Technical Analysis
VALUE Offer - Buy 1 Month & Get 3 Months!Click here
Access 7 Analysts Over 200 Markets Covered. Chat Room With Support