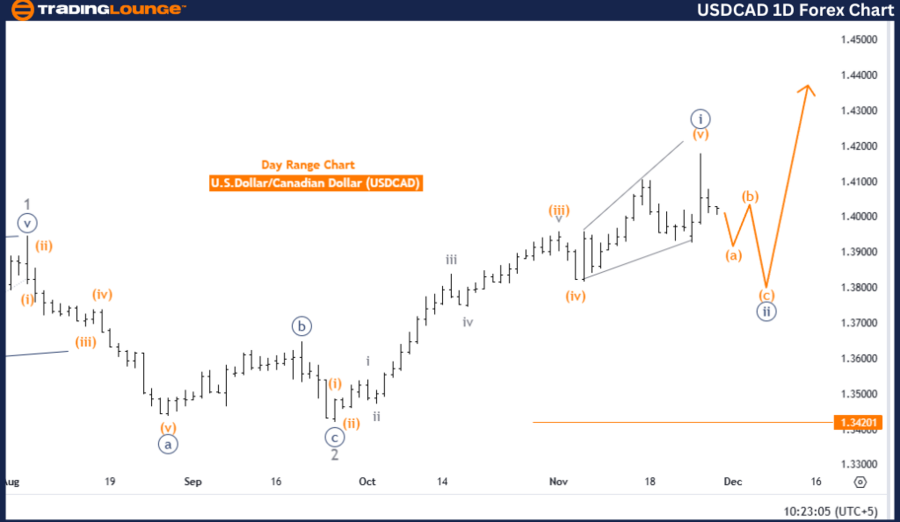
USDCAD Elliott Wave Analysis: Trading Lounge Day Chart

U.S. Dollar/Canadian Dollar (USDCAD) Day Chart Analysis

USDCAD Elliott Wave Technical Analysis

Function: Counter Trend

Mode: Corrective

Structure: Navy Blue Wave 2

Position: Gray Wave 3

Direction Next Higher Degrees: Navy Blue Wave 3

Details: Navy blue wave 1 is completed, and navy blue wave 2 is currently developing.

Wave Cancel Invalidation Level: 1.34201

The analysis utilizes Elliott Wave Theory to examine the USD/CAD pair on a daily chart, currently in a counter-trend phase. The corrective mode reflects a temporary pullback within the broader trend.

The primary structure under analysis is navy blue wave 2, which follows the completed navy blue wave 1. This signals an ongoing correction phase before the anticipated shift to the impulsive navy blue wave 3.

The current wave position is within gray wave 3, which is a smaller wave nested inside the corrective navy blue wave 2 structure. This ongoing correction is expected to progress before transitioning into navy blue wave 3, signaling a continuation of the broader upward impulsive trend.

Key Level for Invalidation

The invalidation level for this wave structure is set at 1.34201. A price movement reaching this level would invalidate the current wave count and corrective outlook, making it a critical reference for risk management and structural confirmation.

Summary

  • Elliott Wave Analysis places USDCAD in a counter-trend phase, with navy blue wave 2 actively developing.

  • Navy blue wave 1 completion initiated this corrective structure, with gray wave 3 highlighting the ongoing movement.
  • The counter-trend scenario holds as long as the price remains above 1.34201.
  • Further corrective activity is anticipated before transitioning into the impulsive navy blue wave 3.

USDCAD-1D-Forex-Char...


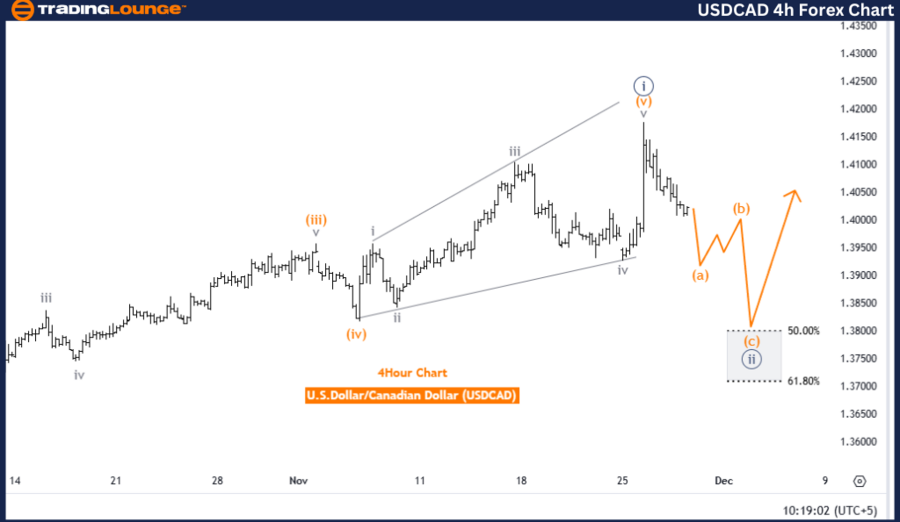
U.S. Dollar/Canadian Dollar (USDCAD) 4-Hour Chart

USDCAD Forex Pair Technical Analysis

Function: Counter Trend

Mode: Impulsive as A

Structure: Orange Wave A

Position: Navy Blue Wave 2

Direction Next Higher Degrees: Orange Wave B

Details: Navy blue wave 1 has been completed, and the orange wave A of navy blue wave 2 is currently developing.

Wave Cancel Invalidation Level: 1.34201

This analysis focuses on USD/CAD using Elliott Wave Theory on a 4-hour chart. The pair is in a counter-trend phase, specifically in the impulsive orange wave A, the first segment of a broader corrective movement.

This phase follows navy blue wave 1’s completion, marking the early stages of navy blue wave 2.

Currently, the position is within orange wave A, reflecting the initial corrective leg. This movement is expected to continue before progressing into orange wave B, which will form the next segment of this correction at a higher degree.

Key Level for Invalidation

The invalidation threshold for this wave structure is defined at 1.34201. Reaching this level would nullify the current wave count and corrective outlook, providing a vital reference point for risk management and confirmation.

Summary

  • Elliott Wave Analysis indicates USDCAD in a counter-trend phase, with orange wave A actively unfolding within navy blue wave 2.
  • Navy blue wave 1 completion initiated this corrective phase.
  • The counter-trend perspective remains valid as long as the price stays above 1.34201.
  • Further movement within orange wave A is expected, followed by the development of orange wave B, completing the corrective structure at a higher degree.

Technical Analyst: Malik Awais

Source: visit Tradinglounge.com and learn From the Experts Join TradingLounge Here 

Previous: USDJPY Elliott Wave Technical Analysis

VALUE Offer - Buy 1 Month & Get 3 Months!Click here

Access 7 Analysts Over 200 Markets Covered. Chat Room With Support

USDCAD-4h-Forex-Char...

Related

British Pound/Japanese Yen(GBPJPY) Elliott Wave Technical Analysis 16 January 24

British Pound/Japanese Yen(GBPJPY) Elliott Wave Technical Analysis 16 January 24

In summary, the GBPJPY Elliott Wave Analysis for the daily chart on 16 January 24, suggests that the...

Read More >
MINERAL RESOURCES LIMITED - MIN Elliott Wave Analysis Reveals Upside Targets After Wave 4 Ends Around $14.05 Low

MINERAL RESOURCES LIMITED - MIN Elliott Wave Analysis Reveals Upside Targets After Wave 4 Ends Around $14.05 Low

Elliott Wave technical analysis for Mineral Resources Limited (ASX: MIN) shows Wave 4 is likely comp...

Read More >
 British Pound / U.S. Dollar (GBPUSD) Elliott Wave Breakdown: Daily Wave 5 Bullish Momentum and 4‑Hour Wave 2 Correction

British Pound / U.S. Dollar (GBPUSD) Elliott Wave Breakdown: Daily Wave 5 Bullish Momentum and 4‑Hour Wave 2 Correction

GBPUSD Elliott Wave analysis showing a bullish impulse (Wave 5) on the daily chart and a corrective...

Read More >
Bullish Elliott Wave Analysis and Trading Strategy for Major Indices Ahead of U.S. Economic Data Releases

Bullish Elliott Wave Analysis and Trading Strategy for Major Indices Ahead of U.S. Economic Data Releases

We are monitoring bullish Elliott Wave patterns across major indices, particularly the S&P 500, NASD...

Read More >
Mastercard (MA) Elliott Wave Technical Analysis: Is a Big Move Coming? Stock Forecast & Trading Insights! Examining Charts

Mastercard (MA) Elliott Wave Technical Analysis: Is a Big Move Coming? Stock Forecast & Trading Insights! Examining Charts

This Elliott Wave analysis of Mastercard Inc. (MA) provides a detailed technical forecast, examining...

Read More >
BTCUSD Elliott Wave Analysis: Bitcoin Price Prediction, Trading Strategy, Support & Resistance Levels, and Crypto Market Trends

BTCUSD Elliott Wave Analysis: Bitcoin Price Prediction, Trading Strategy, Support & Resistance Levels, and Crypto Market Trends

Bitcoin Elliott Wave Forecast with detailed BTCUSD price analysis. Our BTC/USD trading strategy expl...

Read More >

$1 for 2 Weeks

then $29 a month!

What a Special Offer!

Trade Recommendations

Unleash the power of deversified trading with our comprehensive portfolio, covering 250+ markets:

  • Stock Trades
  • Crypto Trades
  • Forex Trades
  • Commodity Trades
Elliott Wave Analysis

Gain a competitive edge with expert insights and AI-powered Elliott Wave charting into:

  • Global Indices
  • US Stocks & ASX Stocks
  • Forex & Crypto
  • Commodities
Top-Notch Trading Tools

Equip yourself with the tools of success:

  • Real-time Chat rooms
  • Elliott Wave Algorithm
  • Portfolio tools
  • TradingLevels
  • Screener
  • Trading Game
7 Elliott Wave Analysts

Stay ahead of the market with daily charts and insightful videos
Your secret to strategic trading!

JOIN HERE


Welcome to TradingLounge (ASIC A.R.No. 321187), specialists in trades, trading education and technical analysis, covering stocks, indices, commodities, forex and cryptocurrencies.

When you join TradingLounge you have access to everything we offer, including trade tools, educational content and a social platform to chat with like-minded investors.

Read more

@Copyright 2024 by tradinglounge.com

Contact Us

Australian no: 02 4787 6020

International no: +61 (2) 47876020

Pay with:

Find us on