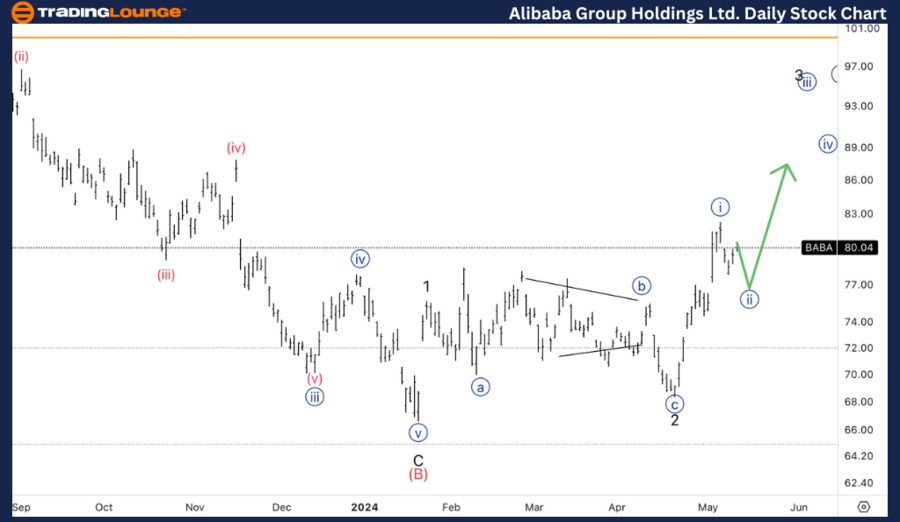
Daily Chart Overview - Alibaba Group Holdings Ltd. (BABA)

Alibaba Group Holdings Ltd.,(BABA) Daily Chart Analysis

BABA Elliott Wave Technical Breakdown

Function: Trend Identification

Mode: Impulsive Movements

Structure: Motive Waves

Position: Minute Wave {i} or {a}

Direction: Undergoing Correction in Wave {ii}

Details:
Alibaba’s stock has demonstrated a significant pattern consistent with Elliott Wave theory, showing five upward movements. These can be interpreted either as the culmination of a Wave C or, as the daily chart suggests, the beginning of a wave {i} in a potentially larger Wave 3 sequence.

Alibaba-Group-Ltd-da...


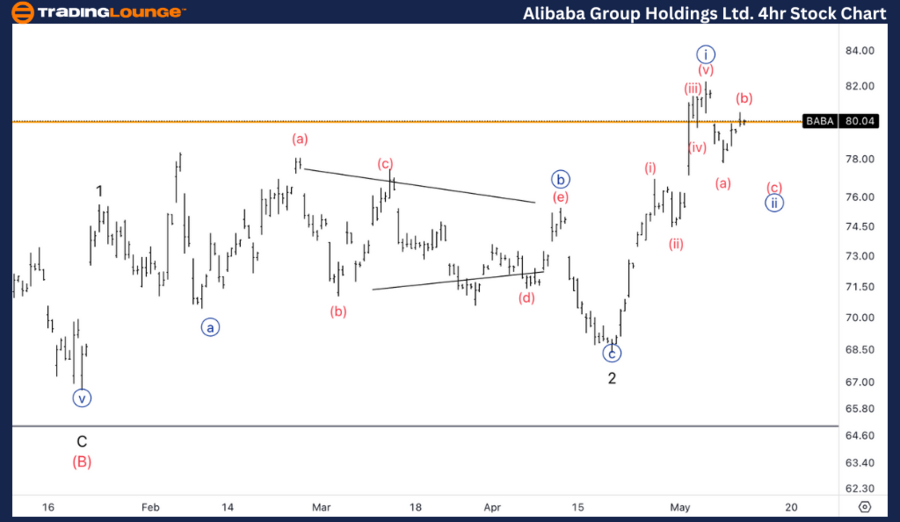
4-Hour Chart Insights - Alibaba Group Holdings Ltd. (BABA)

Elliott Wave Technical Analysis

Function: Trend Identification

Mode: Impulsive Movements

Structure: Motive Waves

Position: Minute Wave {i} or {a}

Direction: Anticipating Correction in Wave {ii}

Details:
The 4-hour chart for BABA indicates a search for a corrective phase around the TL8 price point of $80. This is seen as an optimal entry point for investors, aligning with a Classic Trading Levels Pattern (CTLP). Investors are advised to monitor these levels closely for potential long positions as the pattern unfolds.

Conclusion

Elliott Wave analysis is a dynamic tool that helps decode market trends and investor sentiments associated with stocks like Alibaba Group Holdings Ltd. (BABA). By closely analyzing these wave patterns, investors can enhance their understanding of market dynamics, thereby making informed decisions that align with their financial goals and risk tolerance levels.

Technical Analyst: Malik Awais

Source: visit Tradinglounge.com and learn From the Experts Join TradingLounge Here 

See Previous: Technical Analysis of Meta Platforms Inc.

Special Trial Offer - 0.76 Cents a Day for 3 Months! Click here

Access 7 Analysts Over 170 Markets Covered. Chat Room With Support

Alibaba-Group-Ltd-4H...

Related

Key Technical Analysis Points for REA Group Ltd - REA Stock Analysis & Elliott Wave Technical Forecast

Key Technical Analysis Points for REA Group Ltd - REA Stock Analysis & Elliott Wave Technical Forecast

Our comprehensive Elliott Wave analysis provides an in-depth look at ASX: REA Group Ltd. Learn about...

Read More >
Understand the Bullish Correction Phase: Natural Gas Commodity Elliottwave Technical Analysis

Understand the Bullish Correction Phase: Natural Gas Commodity Elliottwave Technical Analysis

Discover comprehensive insights into the Natural Gas market with our 2024 price forecast. This analy...

Read More >
Gain expert insights into Dogecoin's market Crypto Price: DOGEUSD Elliott Wave Technical Analysis

Gain expert insights into Dogecoin's market Crypto Price: DOGEUSD Elliott Wave Technical Analysis

trends with our comprehensive Elliott Wave analysis. Learn about DOGEUSD technical analysis, trading...

Read More >
KOSPI Composite Index provides valuable insights into daily and weekly trends using Elliott Wave Analysis

KOSPI Composite Index provides valuable insights into daily and weekly trends using Elliott Wave Analysis

This comprehensive analysis of the KOSPI Composite Index provides valuable insights into daily and w...

Read More >
Berkshire Hathaway (BRK.B) Elliott Wave Analysis: Stock Forecast, ZigZag Correction, Triangle Formation & Technical Outlook

Berkshire Hathaway (BRK.B) Elliott Wave Analysis: Stock Forecast, ZigZag Correction, Triangle Formation & Technical Outlook

Elliott Wave analysis of Berkshire Hathaway Inc. (BRK.B), focusing on a corrective zigzag structure ...

Read More >
Soybeans Commodity Elliott Wave Technical Analysis Provides Insights into the Ongoing Downtrend and Potential market trends,

Soybeans Commodity Elliott Wave Technical Analysis Provides Insights into the Ongoing Downtrend and Potential market trends,

Explore in-depth Soybean Elliott Wave Analysis, covering recent price movements, Elliott Wave patter...

Read More >

Buy 1 Month

Get 3 Months!

Special Offer:

Trade Recommendations

Unleash the power of deversified trading with our comprehensive portfolio, covering:

  • Stock Trades
  • Crypto Trades
  • Forex Trades
  • Commodity Trades
Elliott Wave Analysis

Gain a competive edge with expert insights in to:

  • Global Indices
  • US Stocks & ASX Stocks
  • Forex & Crypto
  • Commodities
Top-Notch Trading Tools

Equip yourself with the tools of success:

  • Social Chat
  • Elliott Wave Algorithm
  • Screener
  • TradingLevels
  • Trading Game
7 Elliott Wave Analysts

Stay ahead of the market with daily charts and insightful videos
-Your secret to strategic trading!

JOIN HERE


Welcome to TradingLounge (ASIC A.R.No. 321187), specialists in trades, trading education and technical analysis, covering stocks, indices, commodities, forex and cryptocurrencies.

When you join TradingLounge you have access to everything we offer, including trade tools, educational content and a social platform to chat with like-minded investors.

Read more

@Copyright 2024 by tradinglounge.com

Contact Us

Australian no: 02 4787 6020

International no: +61 (2) 47876020

Pay with:

Find us on