ASX LIMITED – ASX Elliott Wave Analysis TradingLounge (1D Chart)

Greetings! Today's Elliott Wave analysis focuses on ASX LIMITED, listed on the Australian Stock Exchange (ASX). Our analysis suggests that ASX LIMITED could rise soon as it advances through wave ((iii))-navy.

ASX: ASX LIMITED – ASX Elliott Wave Technical Analysis

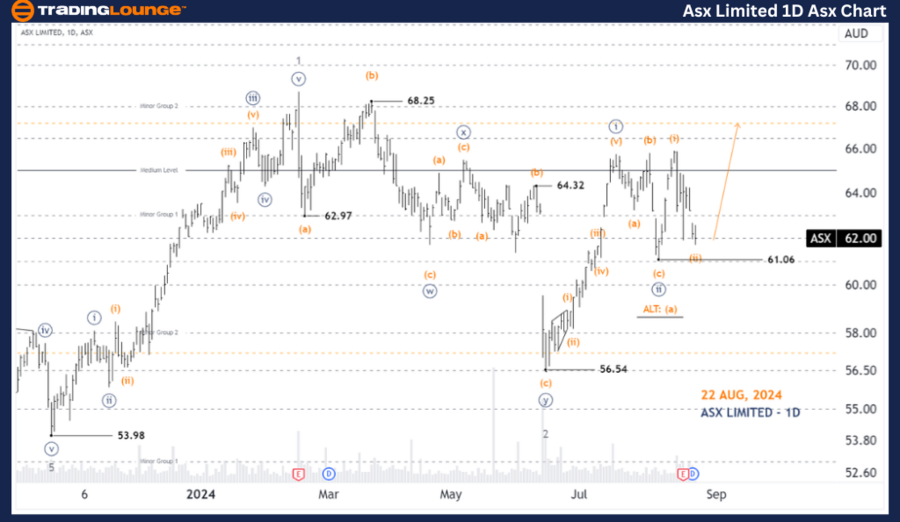
ASX: ASX LIMITED – ASX 1D Chart (Semilog Scale) Analysis

  • Function: Major (Minor degree, gray)
  • Mode: Motive
  • Structure: Impulse
  • Position: Wave (ii)-orange of Wave ((iii))-navy of Wave 3-gray

Details: ASX LIMITED is currently in a critical phase where wave ((iii))-navy could be unfolding higher. However, the recent deep retracement of wave (ii)-orange indicates that the bullish momentum might be weakening. To validate this bullish outlook, the price needs to push higher in the coming days. If it fails to do so, the alternative scenario suggests that wave ((ii))-navy might extend longer than anticipated. A potential Long Trade Setup may emerge around the Medium Level of 65.00.

  • Invalidation Point: 61.06

ASX-LIMITED-1D-Asx-C...


ASX: ASX LIMITED – ASX Elliott Wave Analysis TradingLounge (4-Hour Chart)

ASX: ASX LIMITED – ASX Elliott Wave Technical Analysis

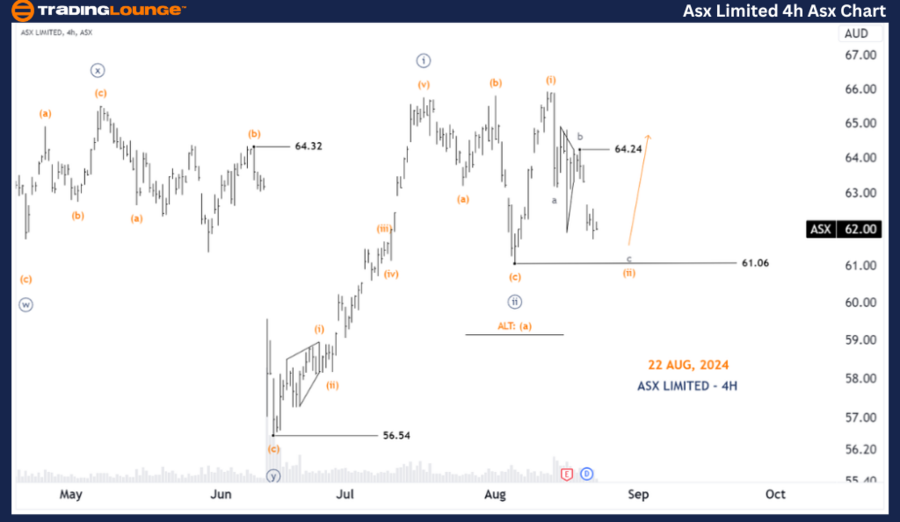
ASX: ASX LIMITED – ASX 4-Hour Chart Analysis

  • Function: Major Trend (Minute degree, navy)
  • Mode: Motive
  • Structure: Impulse
  • Position: Wave (ii)-orange of Wave ((iii))-navy

Details: A closer examination of the 4-hour chart reveals a potential Zigzag pattern in the wave (ii)-orange retracement, which is nearing its completion. For the bullish scenario to remain intact, the price needs to rise above 64.24 and consistently hold above 61.08. This would signal a high-quality Long Trade Setup. However, a drop below 61.06 would indicate that wave ((ii))-navy is developing into a more complex and extended pattern, although wave ((iii))-navy is still expected to push higher eventually.

  • Invalidation Point: 61.06
  • Confirmation Point: 64.24

Technical Analyst: Hua (Shane) Cuong, CEWA-M (Master’s Designation).

Source: visit Tradinglounge.com and learn From the Experts Join TradingLounge Here 

Previous:  V300AEQ ETF UNITS – VAS Elliott Wave Technical Analysis

Special Trial Offer - 0.76 Cents a Day for 3 Months! Click here

Access 7 Analysts Over 200 Markets Covered. Chat Room With Support

ASX-LIMITED-4hr-Asx-...


Conclusion:

Our analysis provides insights into ASX LIMITED's current market trends, focusing on short-term outlooks and potential trading opportunities. We highlight key price levels that serve as validation or invalidation points for our wave count, helping to bolster confidence in our forecast. Through this approach, we aim to offer a clear and professional perspective on market dynamics, enabling informed decision-making.

Related

Wheat Commodity Elliott Wave Technical Analysis: Unveiling the Path Towards Market Recovery

Wheat Commodity Elliott Wave Technical Analysis: Unveiling the Path Towards Market Recovery

Dive into the comprehensive guide on Elliott Wave analysis for wheat trading, where we explore cutti...

Read More >
RUSSELL 2000 Index Elliott Wave Technical Analysis: Best Stocks to buy and Market Forecasts

RUSSELL 2000 Index Elliott Wave Technical Analysis: Best Stocks to buy and Market Forecasts

This article offers an in-depth Elliott Wave analysis of the Russell 2000, providing valuable insigh...

Read More >
Natural Gas Commodity Elliott Wave Technical Analysis: Market Trends and Strategic Insights

Natural Gas Commodity Elliott Wave Technical Analysis: Market Trends and Strategic Insights

This article provides an in-depth natural gas Elliott Wave analysis, highlighting current bearish tr...

Read More >
ASX: Santos Limited (STO) Stock Analysis & Elliott Wave Technical Forecast with Key Trends and Actionable Trading Strategies

ASX: Santos Limited (STO) Stock Analysis & Elliott Wave Technical Forecast with Key Trends and Actionable Trading Strategies

Get detailed Elliott Wave analysis for ASX: SANTOS LIMITED (STO), including stock trends, price pred...

Read More >
Walmart Inc. Stock Technical Forecast Using Elliott Wave: Bullish Wave (iii) Setup Validates Breakout Potential in WMT Price Chart

Walmart Inc. Stock Technical Forecast Using Elliott Wave: Bullish Wave (iii) Setup Validates Breakout Potential in WMT Price Chart

This analysis explores Walmart's (WMT) bullish outlook using Elliott Wave theory, identifying a ...

Read More >
NIFTY 50 Elliott Wave Technical Analysis for 2025: Corrective Waves, Trend Reversals, Expanded Flat Patterns, and Key Price Levels

NIFTY 50 Elliott Wave Technical Analysis for 2025: Corrective Waves, Trend Reversals, Expanded Flat Patterns, and Key Price Levels

NIFTY 50 index uses Elliott Wave principles to forecast key market movements, including corrective w...

Read More >

$1 for 2 Weeks

then $29 a month!

What a Special Offer!

Trade Recommendations

Unleash the power of deversified trading with our comprehensive portfolio, covering 250+ markets:

  • Stock Trades
  • Crypto Trades
  • Forex Trades
  • Commodity Trades
Elliott Wave Analysis

Gain a competitive edge with expert insights and AI-powered Elliott Wave charting into:

  • Global Indices
  • US Stocks & ASX Stocks
  • Forex & Crypto
  • Commodities
Top-Notch Trading Tools

Equip yourself with the tools of success:

  • Real-time Chat rooms
  • Elliott Wave Algorithm
  • Portfolio tools
  • TradingLevels
  • Screener
  • Trading Game
7 Elliott Wave Analysts

Stay ahead of the market with daily charts and insightful videos
Your secret to strategic trading!

JOIN HERE


Welcome to TradingLounge (ASIC A.R.No. 321187), specialists in trades, trading education and technical analysis, covering stocks, indices, commodities, forex and cryptocurrencies.

When you join TradingLounge you have access to everything we offer, including trade tools, educational content and a social platform to chat with like-minded investors.

Read more

@Copyright 2024 by tradinglounge.com

Contact Us

Australian no: 02 4787 6020

International no: +61 (2) 47876020

Pay with:

Find us on