05Dec

Amazon Inc.(AMZN:NASDAQ) Elliott Wave Technical Analysis 5 December 23

Amazon Inc., Elliott Wave Technical Analysis

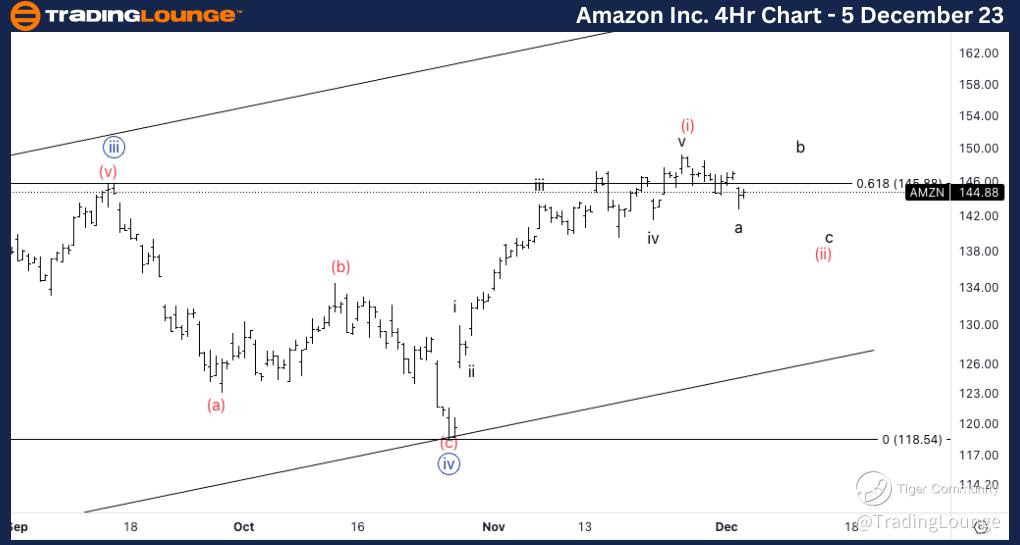
Amazon Inc., (AMZN:NASDAQ): 4h Chart 5 December 23

AMZN Stock Market Analysis: Looking for a top in wave (i) in place as we have taken out the previous top. The more conservative alternate is that wave {v} is in place and we are due wave 4.  

AMZN Elliott Wave Count: Wave (ii) of {v}.  

AMZN Technical Indicators: Below 20EMA  

AMZN Trading Strategy: Looking for longs once the wave (i) top gets taken out.  

TradingLounge Analyst: Alessio Barretta

Source: Tradinglounge.com get trial here!

AMZN-4Hr-Stock-Chart...


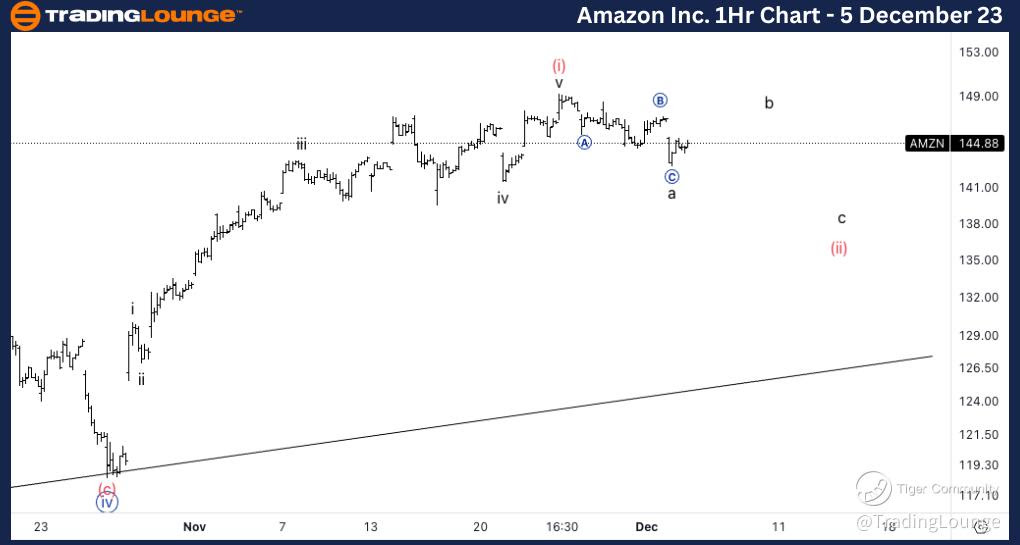
Amazon Inc., AMZN: 1-hour Chart, 5 December 23

Amazon Inc., Elliott Wave Technical Analysis 

AMZN Stock Market Analysis: Looking for a three wave move into wave a and we are now looking for a pullback in wave b. Ideally we will get support between 138$.  

AMZN Elliott Wave count:  Wave b of (ii). s

AMZN Technical Indicators: Between 20 and 200EMA.

AMZN Trading Strategy: Looking for longs once the wave (i) top gets taken out.

AMZN-1Hr-Stock-Chart...

Related

ASX: Mineral Resources Limited (MIN) - Elliott Wave Analysis & Stock Forecast With Possible Upward Trends

ASX: Mineral Resources Limited (MIN) - Elliott Wave Analysis & Stock Forecast With Possible Upward Trends

This article provides an Elliott Wave analysis for ASX: Mineral Resources Limited (MIN), highlightin...

Read More >
U.S. Dollar / Swiss Franc Forex Technical Analysis | USDCHF Elliott Wave Analysis: Day and 4-Hour Chart Forecast for Traders

U.S. Dollar / Swiss Franc Forex Technical Analysis | USDCHF Elliott Wave Analysis: Day and 4-Hour Chart Forecast for Traders

This post provides a comprehensive USDCHF Elliott Wave analysis, including insights from day and 4-h...

Read More >
Understand PYPL’s Market Direction and Anticipated Price Movements: PayPal Holdings Inc. Stocks Elliott Wave Technical Analysis

Understand PYPL’s Market Direction and Anticipated Price Movements: PayPal Holdings Inc. Stocks Elliott Wave Technical Analysis

This analysis of PayPal Holdings Inc. (PYPL) offers a detailed look at both daily and 1-hour chart p...

Read More >
Copper Commodity Elliott Wave Technical Analysis: Ongoing Corrections, Wave Structures, and Key Resistance Zones

Copper Commodity Elliott Wave Technical Analysis: Ongoing Corrections, Wave Structures, and Key Resistance Zones

This article provides a detailed analysis of Copper prices using Elliott Wave theory. It covers the ...

Read More >
Euro/U.S.Dollar(EURUSD) Day Chart Elliott Wave Technical Analysis 10 November 23

Euro/U.S.Dollar(EURUSD) Day Chart Elliott Wave Technical Analysis 10 November 23

Euro/U.S.Dollar(EURUSD) Day Chart Elliott Wave Technical Analysis 10 November 23 suggests a Counter ...

Read More >

$1 for 2 Weeks

then $29 a month!

What a Special Offer!

Trade Recommendations

Unleash the power of deversified trading with our comprehensive portfolio, covering 250+ markets:

  • Stock Trades
  • Crypto Trades
  • Forex Trades
  • Commodity Trades
Elliott Wave Analysis

Gain a competitive edge with expert insights and AI-powered Elliott Wave charting into:

  • Global Indices
  • US Stocks & ASX Stocks
  • Forex & Crypto
  • Commodities
Top-Notch Trading Tools

Equip yourself with the tools of success:

  • Real-time Chat rooms
  • Elliott Wave Algorithm
  • Portfolio tools
  • TradingLevels
  • Screener
  • Trading Game
7 Elliott Wave Analysts

Stay ahead of the market with daily charts and insightful videos
Your secret to strategic trading!

JOIN HERE


Welcome to TradingLounge (ASIC A.R.No. 321187), specialists in trades, trading education and technical analysis, covering stocks, indices, commodities, forex and cryptocurrencies.

When you join TradingLounge you have access to everything we offer, including trade tools, educational content and a social platform to chat with like-minded investors.

Read more

@Copyright 2024 by tradinglounge.com

Contact Us

Australian no: 02 4787 6020

International no: +61 (2) 47876020

Pay with:

Find us on