Silver Elliott Wave Analysis: A Path Toward New Heights

Silver XAGUSD Commodity Chart Analysis

Silver XAGUSD Elliott Wave Technical Analysis

Function: Trend

Mode: Trend

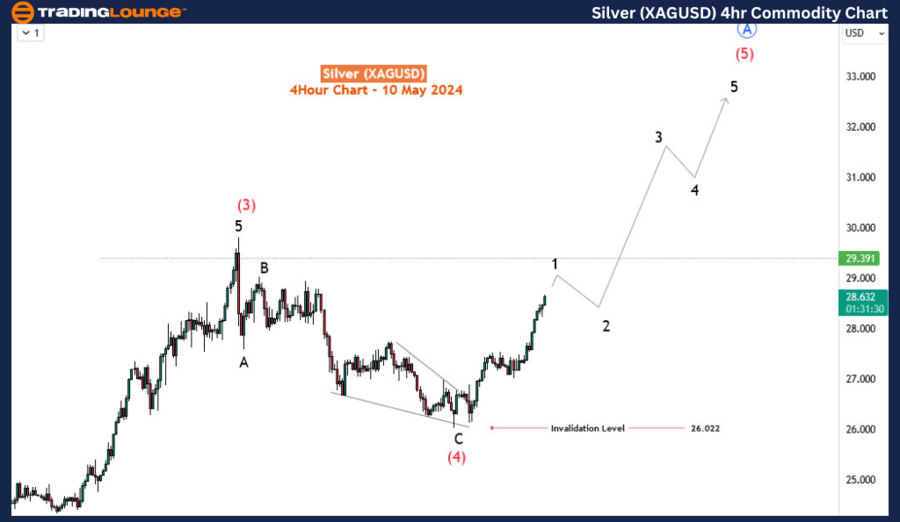
Structure: Impulse for (A)

Position: Wave 5 of (A)

Direction: Active Wave 5 of (A)

Details: Impulse Breakout Underway in Silver's Wave 5

Silver is currently making significant strides in its price movement, embarking on the fifth wave of its Elliott Wave sequence labeled as (A). This phase is marked by a robust impulse breakout from the diagonal conclusion of wave 4, setting the stage for the first sub-wave—termed blue wave i (circled) of 5 of (A).

Silver’s Bullish Recovery: Testing 2013 Highs

Since recovering from its April 12th downturn, which lasted nearly three weeks, silver has regained its momentum and is on track to challenge the peak prices of 2013. This revival signals a continuation of the bullish trend that has characterized the majority of the year.

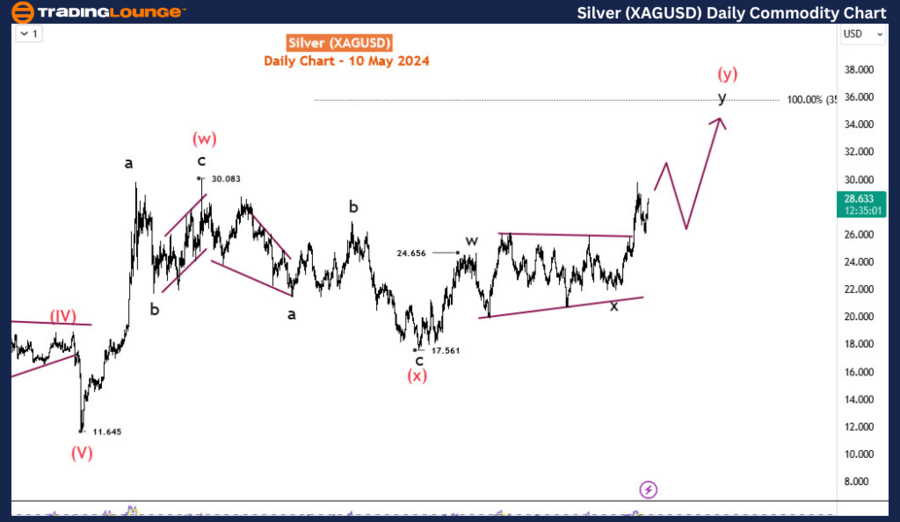
Long-Term Prospects: A Beacon for Buyers

Looking at the long-term performance, silver reached its lowest point in March 2020 at $11.645, establishing a strong foundation for a potential rally. Current patterns and analyses suggest a likely progression into a corrective phase, possibly adopting a zigzag or double zigzag structure. The daily chart analysis reveals a double zigzag pattern in progress within the third leg of the supercycle degree—wave (y). Projections for wave (y) indicate a possible extension to the 100% projection of wave (w) from (x), suggesting a silver price target of $35.78. This scenario would represent a 25% increase from its current price, potentially materializing over the next six months or longer.

Alternatively, the bullish trajectory from the March 2020 lows could be interpreted as an impulse wave, aiming for higher targets beyond $42.75, with possibilities of reaching up to $47.00. Regardless of the pathway, silver is positioned for continued upward trends in the near future.

Silver-XAGUSD-Daily-...


Near-Term Analysis: H4 Chart Insights

The impulse wave sequence that began in January 2024 has recently completed its fourth wave—wave (4)—characterized by a zigzag structure. The momentum is now poised to propel the commodity higher into wave (5) of the primary degree wave A (highlighted in blue). With the critical support level at $26.022 remaining intact, silver is expected to attract considerable buying interest in the upcoming weeks and months.

Technical Analyst: Sanmi Adeagbo

Source: visit Tradinglounge.com and learn From the Experts Join TradingLounge Here 

See Previous: Soybeans Commodity Elliott Wave Technical Analysis

Special Trial Offer - 0.76 Cents a Day for 3 Months! Click here

Access 7 Analysts Over 170 Markets Covered. Chat Room With Support

Silver-XAGUSD-4Hr-Co...

Related

Federal Reserve Cuts Rates to 5%: Elliott Wave Analysis of Major Stock Indices & Market Insights

Federal Reserve Cuts Rates to 5%: Elliott Wave Analysis of Major Stock Indices & Market Insights

This blog offers an in-depth analysis of major stock market indices—including the S&P 500, NASDAQ 1...

Read More >
KOSPI Composite Elliott Wave Analysis: Market Forecast, Key Support at 2,438.17, Trading Strategy & Price Prediction

KOSPI Composite Elliott Wave Analysis: Market Forecast, Key Support at 2,438.17, Trading Strategy & Price Prediction

The KOSPI Composite Elliott Wave Analysis indicates a bullish trend, with the market currently in Or...

Read More >
The Procter & Gamble Company (PG) Elliott Wave Technical Analysis 9 February 24

The Procter & Gamble Company (PG) Elliott Wave Technical Analysis 9 February 24

Delve into the world of trading with a comprehensive analysis of Procter & Gamble (PG) stock using E...

Read More >
Wheat Commodity Elliott Wave Technical Analysis: Bullish Corrections and Future Price Movements in Wheat Futures

Wheat Commodity Elliott Wave Technical Analysis: Bullish Corrections and Future Price Movements in Wheat Futures

Our latest wheat price forecast for 2024 is based on Elliott Wave analysis, highlighting key market ...

Read More >
GBPAUD Elliott Wave Technical Analysis: Corrective Wave 2, Retracement Dynamics, Invalidation Levels, and Trading Strategies Explained

GBPAUD Elliott Wave Technical Analysis: Corrective Wave 2, Retracement Dynamics, Invalidation Levels, and Trading Strategies Explained

Unlock expert insights into GBPAUD Elliott Wave analysis, focusing on corrective wave 2 within the l...

Read More >
Commodities & Futures Market Analysis: Elliott Wave Insights & Strategies

Commodities & Futures Market Analysis: Elliott Wave Insights & Strategies

COMMODITY MARKETS: Bond Yields, USD Dollar DXY, US Gold, Silver, Iron Ore,Copper, Uranium, Oil, Gas

Read More >

$1 for 2 Weeks

then $29 a month!

What a Special Offer!

Trade Recommendations

Unleash the power of deversified trading with our comprehensive portfolio, covering 250+ markets:

  • Stock Trades
  • Crypto Trades
  • Forex Trades
  • Commodity Trades
Elliott Wave Analysis

Gain a competitive edge with expert insights and AI-powered Elliott Wave charting into:

  • Global Indices
  • US Stocks & ASX Stocks
  • Forex & Crypto
  • Commodities
Top-Notch Trading Tools

Equip yourself with the tools of success:

  • Real-time Chat rooms
  • Elliott Wave Algorithm
  • Portfolio tools
  • TradingLevels
  • Screener
  • Trading Game
7 Elliott Wave Analysts

Stay ahead of the market with daily charts and insightful videos
Your secret to strategic trading!

JOIN HERE


Welcome to TradingLounge (ASIC A.R.No. 321187), specialists in trades, trading education and technical analysis, covering stocks, indices, commodities, forex and cryptocurrencies.

When you join TradingLounge you have access to everything we offer, including trade tools, educational content and a social platform to chat with like-minded investors.

Read more

@Copyright 2024 by tradinglounge.com

Contact Us

Australian no: 02 4787 6020

International no: +61 (2) 47876020

Pay with:

Find us on