PG Elliott Wave Analysis Trading Lounge Daily Chart, 9 February 24

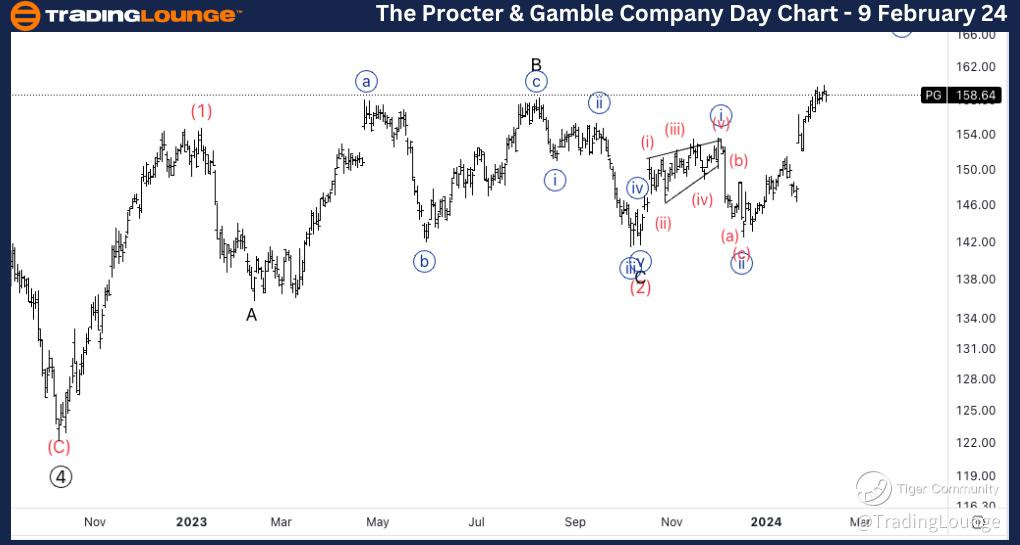
The Procter & Gamble Company, (PG) TradingLounge Daily Chart

PG Elliott Wave Technical Analysis

FUNCTION: Trend

MODE: Impulse

STRUCTURE: Motive

POSITION: Minor wave 1 of (3).

DIRECTION: Acceleration in wave (3).  

DETAILS: Looking for upside resumption as we have found support on Medium Level 150$ and we are now trading above the previous resistance we have broken it with increasing volume suggesting the move is trend-establishing, rather than corrective.
Procter-Gamble-Day-s...


PG Elliott Wave Analysis Trading Lounge 4Hr Chart, 9 February 24

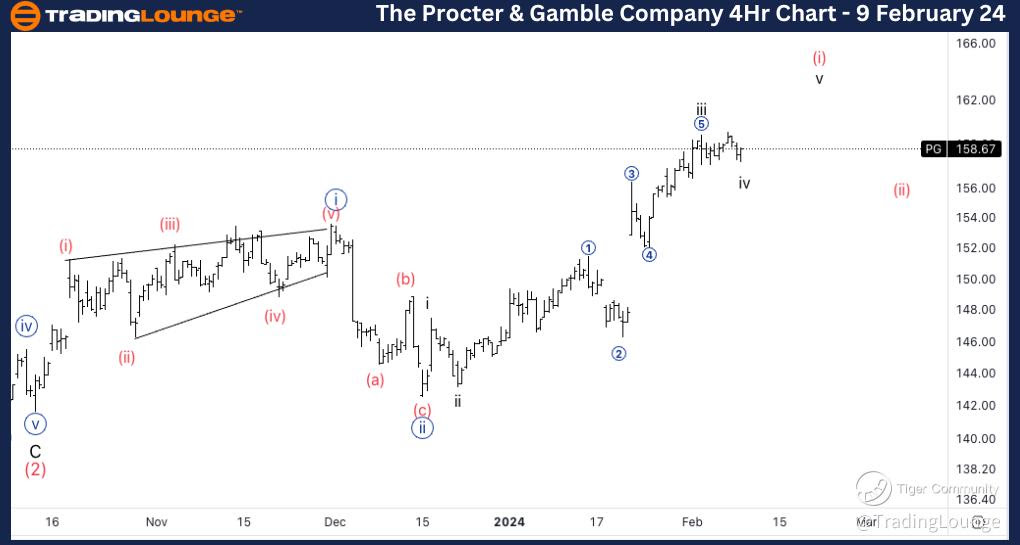
The Procter & Gamble Company,  (PG) 4Hr Chart

PG Elliott Wave Technical Analysis

FUNCTION: Trend

MODE: Impulsive

STRUCTURE: Motive

POSITION: Wave (i) of {iii}.  

DIRECTION: Upside into wave v of (i).

DETAILS: Looking for a continuation higher on the intraday as every pullback to the downside seems to be a three-wave move and therefore corrective in nature. Looking for a top soon in what could be either wave (i) of {iii} or else wave {iii}.

Technical Analyst: Alessio Barretta

Source: visit Tradinglounge.com and learn From the Experts Join TradingLounge Here 

See Previous: Visa Inc. (V)
Procter-Gamble-4Hr-s...


Welcome to our PG Elliott Wave Analysis Trading Lounge, your trusted source for comprehensive insights into The Procter & Gamble Company (PG) through Elliott Wave Technical Analysis. As of the Daily Chart on 9th February 2024, we uncover pivotal trends guiding the market.

*PG Elliott Wave Technical Analysis – Daily Chart*

In terms of wave dynamics, we discern a dominant impulse function with a motive structure. The current position is in Minor wave 1 of (3), indicating acceleration in wave (3). Our focus is on the resumption of upside momentum, particularly as we find support at the Medium Level of $150. Notably, trading above previous resistance with increasing volume suggests a trend-establishing move rather than a corrective one.

*PG Elliott Wave Technical Analysis – 4Hr Chart*

Here, the wave function remains impulsive with a motive structure. The present position is in Wave (i) of {iii}, signaling an upside movement into wave v of (i). We anticipate continued upward momentum intraday, especially as pullbacks to the downside manifest as three-wave moves, indicative of corrective nature. We remain vigilant for a potential top, which could signify either wave (i) of {iii} or wave {iii}.


Related

Providing Forecasts for the British Pound to U.S. Dollar Currency Pair: GBPUSD Forex Elliott Wave Technical Analysis

Providing Forecasts for the British Pound to U.S. Dollar Currency Pair: GBPUSD Forex Elliott Wave Technical Analysis

Our detailed GBPUSD Elliott Wave analysis covers daily and 4-hour chart evaluations, providing forec...

Read More >
Gold (XAUUSD) Commodity Elliott Wave Technical Analysis: Examining the latest trends and price movements

Gold (XAUUSD) Commodity Elliott Wave Technical Analysis: Examining the latest trends and price movements

This article provides an in-depth Elliott Wave analysis of the gold market, examining the latest tre...

Read More >
Bovespa Set for Breakout? Elliott Wave Technical Analysis Signals Powerful Bullish Wave 3 Surge with Critical Level at 122,486

Bovespa Set for Breakout? Elliott Wave Technical Analysis Signals Powerful Bullish Wave 3 Surge with Critical Level at 122,486

Daily and weekly Elliott Wave breakdown shows Bovespa in impulsive bullish phases—Orange Wave 3 on ...

Read More >
Understand how Elliott Wave Theory Applies to DIS Stock's Future Trajectory: The Walt Disney Co. Technical Analysis

Understand how Elliott Wave Theory Applies to DIS Stock's Future Trajectory: The Walt Disney Co. Technical Analysis

Explore an in-depth Elliott Wave analysis of The Walt Disney Co. (DIS), highlighting current price m...

Read More >
ASX: WiseTech Global Limited (WTC) - Elliott Wave Analysis, Stock Trends, Technical Charts, Price Forecasts, and Trading Strategies

ASX: WiseTech Global Limited (WTC) - Elliott Wave Analysis, Stock Trends, Technical Charts, Price Forecasts, and Trading Strategies

This article provides an in-depth Elliott Wave analysis for ASX: WiseTech Global Limited (WTC), focu...

Read More >
Wheat Price Forecast 2025: Wheat Commodity Elliott Wave Signals End of Bearish Cycle with Support Near $500 for Trend Reversal

Wheat Price Forecast 2025: Wheat Commodity Elliott Wave Signals End of Bearish Cycle with Support Near $500 for Trend Reversal

Wheat futures remain bearish, but Elliott Wave analysis signals a potential reversal near $500 as an...

Read More >

$1 for 2 Weeks

then $29 a month!

What a Special Offer!

Trade Recommendations

Unleash the power of deversified trading with our comprehensive portfolio, covering 250+ markets:

  • Stock Trades
  • Crypto Trades
  • Forex Trades
  • Commodity Trades
Elliott Wave Analysis

Gain a competitive edge with expert insights and AI-powered Elliott Wave charting into:

  • Global Indices
  • US Stocks & ASX Stocks
  • Forex & Crypto
  • Commodities
Top-Notch Trading Tools

Equip yourself with the tools of success:

  • Real-time Chat rooms
  • Elliott Wave Algorithm
  • Portfolio tools
  • TradingLevels
  • Screener
  • Trading Game
7 Elliott Wave Analysts

Stay ahead of the market with daily charts and insightful videos
Your secret to strategic trading!

JOIN HERE


Welcome to TradingLounge (ASIC A.R.No. 321187), specialists in trades, trading education and technical analysis, covering stocks, indices, commodities, forex and cryptocurrencies.

When you join TradingLounge you have access to everything we offer, including trade tools, educational content and a social platform to chat with like-minded investors.

Read more

@Copyright 2024 by tradinglounge.com

Contact Us

Australian no: 02 4787 6020

International no: +61 (2) 47876020

Pay with:

Find us on