08Feb

Visa Inc. (V) Elliott Wave Technical Analysis: Daily and 4Hr Chart Insights 8 February 24

Unlock the potential of Visa Inc. (V) with our in-depth Elliott Wave Technical analysis from Trading Lounge. Dive into the daily and 4Hr charts to grasp the intricate patterns and trends that could shape your trading decisions.

Visa Inc. (V) Daily Chart Elliott Wave Analysis
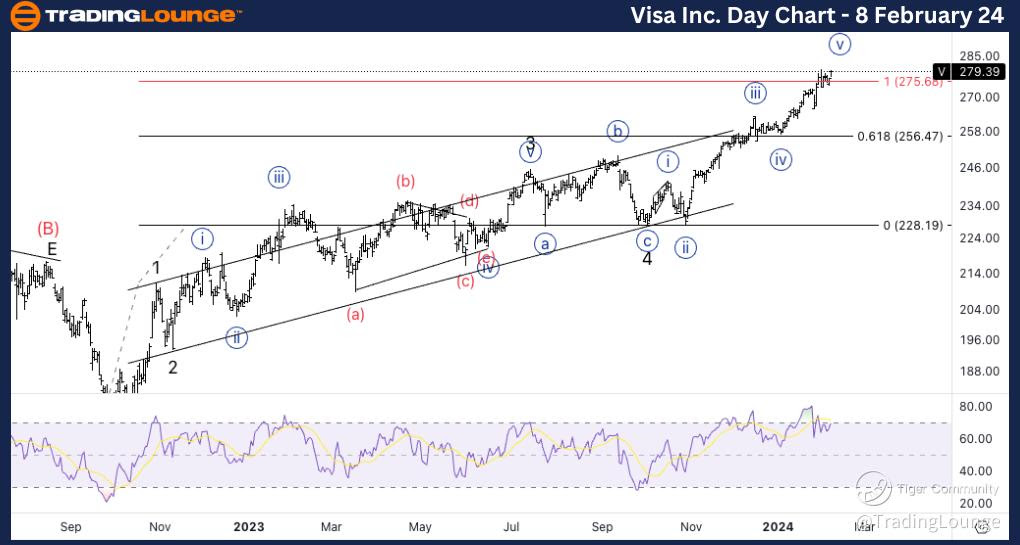
Function: Trend

Mode: Impulse

Structure: Motive

Position: Minor wave 5 of (1)

Direction: Top in wave 5

Are you prepared for Visa Inc.'s potential upswing? Our analysis indicates that we're currently navigating minor wave 5 of (1), poised at a critical juncture. While the trend remains upward, it's crucial to monitor the RSI bearish divergence signaling a possible impending top. Additionally, an alternative count is suggesting the presence of waves 1 and 2, potentially affecting our outlook on current waves 3 and 4.

Visa-Inc-Day-Stock-c...


Visa Inc. (V) 4Hr Chart Elliott Wave Analysis
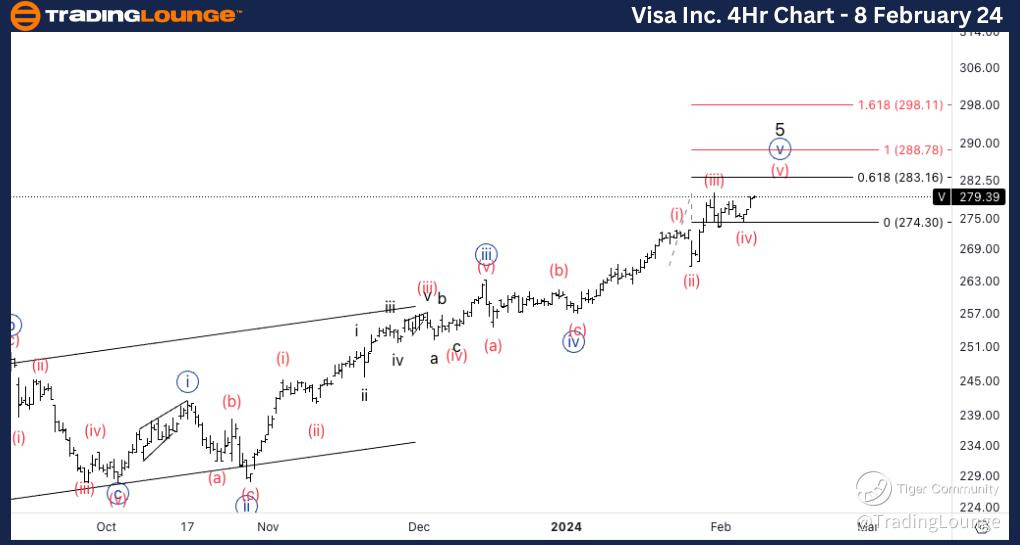
Function: Trend

Mode: Impulsive

Structure: Motive

Position: Wave (v) of {v}

Direction: Upside into wave (v)

Don't miss out on the potential upside momentum indicated by our 4Hr chart analysis for Visa Inc. (V). We're currently tracking wave (v) of {v}, highlighting a strong upward trend. It's essential to note that wave (iii) was shorter than wave (v), suggesting a crucial validation level at 288$. Keep a close eye on the resistance levels, with MG2 marking a significant barrier at 280$ and TL3 presenting a potential milestone at 300$.

Technical Analyst: Alessio Barretta

Source: visit Tradinglounge.com and learn From the Experts Join TradingLounge Here 

See Previous: Berkshire Hathaway Inc. (BRK.B)

Visa-Inc-4H-Stock-ch...


Welcome to our V Elliott Wave Analysis Trading Lounge, your premier destination for in-depth analysis of Visa Inc. (V) through Elliott Wave Technical Analysis. As of the Daily Chart on 8th February 2024, we unravel crucial insights into market trends.

*V Elliott Wave Technical Analysis – Daily Chart*

In terms of wave dynamics, we observe a prevailing impulse function with a motive structure. The current position is in Minor wave 5 of (1), indicating a potential top in wave 5. Our focus lies in monitoring the remaining upside potential. Notably, we identify an RSI bearish divergence, hinting at a looming top. Additionally, an alternative count suggests the current wave 3 and 4 might be wave 1 and 2, adding complexity to the analysis.

*V Elliott Wave Technical Analysis – 4H Chart*

Here, the wave function maintains its impulsive nature with a motive structure. The present position is in Wave (v) of {v}, signaling an upside movement into wave (v). Notably, to maintain wave count integrity, wave (v) must be shorter than wave (iii), with an invalidation level set at $288. Key resistance levels include the end of MG2 at $280 and TL3 at $300.


Related

Insights for Traders on ChainLink's Price Movement, Trading Strategies and Technical Indicators: LINKUSD Elliott Wave Analysis

Insights for Traders on ChainLink's Price Movement, Trading Strategies and Technical Indicators: LINKUSD Elliott Wave Analysis

This detailed analysis covers ChainLink (LINKUSD) price prediction using Elliott Wave theory, focusi...

Read More >
British Pound/Japanese Yen(GBPJPY) Elliott Wave Technical Analysis 16 January 24

British Pound/Japanese Yen(GBPJPY) Elliott Wave Technical Analysis 16 January 24

In summary, the GBPJPY Elliott Wave Analysis for the daily chart on 16 January 24, suggests that the...

Read More >
Thoroughly Analyses the CAC 40, Featuring Elliott Wave Insights, Technical Analysis, and Forecasts: CAC 40 Trading Strategies

Thoroughly Analyses the CAC 40, Featuring Elliott Wave Insights, Technical Analysis, and Forecasts: CAC 40 Trading Strategies

This article thoroughly analyses the CAC 40, featuring Elliott Wave insights, technical analysis, an...

Read More >
Expert Guidance on CSL Limited ASX Stock with key Price Points and Forecasted Movements: CSL Elliott Wave Analysis

Expert Guidance on CSL Limited ASX Stock with key Price Points and Forecasted Movements: CSL Elliott Wave Analysis

This article provides an in-depth Elliott Wave analysis of CSL Limited (ASX: CSL), offering valuable...

Read More >
Elliott Wave Technical Analysis of iShares Biotechnology ETF (IBB) Reveals Bullish Buy Zones, Forecasting Major Upside Rally

Elliott Wave Technical Analysis of iShares Biotechnology ETF (IBB) Reveals Bullish Buy Zones, Forecasting Major Upside Rally

The iShares Biotechnology ETF (IBB) shows a strong post-triangle thrust based on Elliott Wave analys...

Read More >

$1 for 2 Weeks

then $29 a month!

What a Special Offer!

Trade Recommendations

Unleash the power of deversified trading with our comprehensive portfolio, covering 250+ markets:

  • Stock Trades
  • Crypto Trades
  • Forex Trades
  • Commodity Trades
Elliott Wave Analysis

Gain a competitive edge with expert insights and AI-powered Elliott Wave charting into:

  • Global Indices
  • US Stocks & ASX Stocks
  • Forex & Crypto
  • Commodities
Top-Notch Trading Tools

Equip yourself with the tools of success:

  • Real-time Chat rooms
  • Elliott Wave Algorithm
  • Portfolio tools
  • TradingLevels
  • Screener
  • Trading Game
7 Elliott Wave Analysts

Stay ahead of the market with daily charts and insightful videos
Your secret to strategic trading!

JOIN HERE


Welcome to TradingLounge (ASIC A.R.No. 321187), specialists in trades, trading education and technical analysis, covering stocks, indices, commodities, forex and cryptocurrencies.

When you join TradingLounge you have access to everything we offer, including trade tools, educational content and a social platform to chat with like-minded investors.

Read more

@Copyright 2024 by tradinglounge.com

Contact Us

Australian no: 02 4787 6020

International no: +61 (2) 47876020

Pay with:

Find us on