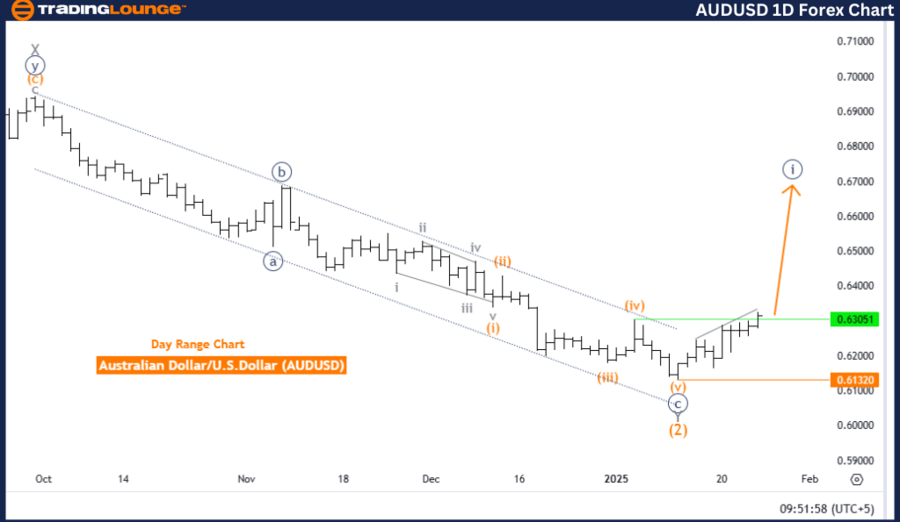
Australian Dollar/U.S. Dollar (AUDUSD) Elliott Wave Analysis - Trading Lounge Day Chart
AUDUSD Elliott Wave Technical Analysis
Function: Bullish Trend
Mode: Impulsive
Structure: Navy Blue Wave 1
Position: Gray Wave 1
Direction (Next Lower Degree): Navy Blue Wave 2
Invalidation Level: 0.61320
The daily AUDUSD chart analysis, based on Elliott Wave Theory, indicates a bullish trend with an impulsive mode, emphasizing the formation of navy blue wave 1 within the broader gray wave 1 structure. This pattern suggests the start of a new upward market movement, reinforcing positive momentum.
At present, navy blue wave 1 is progressing within gray wave 1, signaling strong bullish potential. After the completion of navy blue wave 1, the next phase, navy blue wave 2, is expected to initiate a corrective cycle, offering an opportunity for market consolidation before the next upward push.
The invalidation level of 0.61320 serves as a key threshold to confirm the validity of the current Elliott Wave count. A decline below this level would indicate a need for reassessment of the wave structure and potential market shifts.
Summary
- The AUDUSD daily chart analysis maintains a bullish outlook, with navy blue wave 1 progressing within gray wave 1.
- The formation of navy blue wave 2 is anticipated, allowing traders to monitor market corrections before further upward movement.
- The invalidation level at 0.61320 is crucial for risk management and validating the bullish trend projection.
- This analysis offers traders valuable insights into early-stage trend formations and aligns with the Elliott Wave framework, supporting strategic trading decisions.

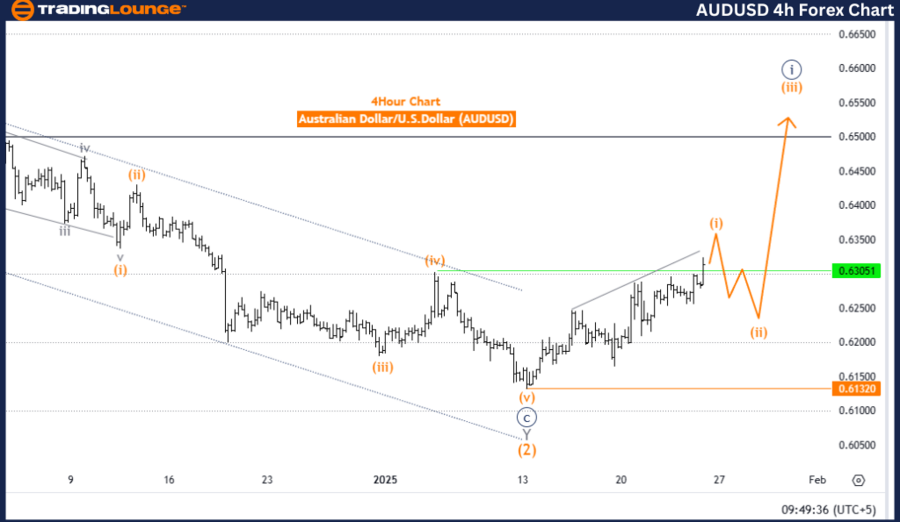
Australian Dollar/U.S. Dollar (AUDUSD) Elliott Wave Analysis - Trading Lounge 4-Hour Chart
AUDUSD Elliott Wave Technical Analysis
Function: Bullish Trend
Mode: Impulsive
Structure: Orange Wave 1
Position: Navy Blue Wave 1
Direction (Next Lower Degree): Orange Wave 2
Invalidation Level: 0.61320
The 4-hour AUDUSD analysis, applying Elliott Wave Theory, confirms a bullish market trend in an impulsive phase, highlighting the development of orange wave 1 within the broader navy blue wave 1 structure. This wave formation suggests the initiation of a new upward trajectory.
Currently, orange wave 1 is advancing within navy blue wave 1, reinforcing strong bullish sentiment. Upon completion of orange wave 1, the emergence of orange wave 2 is expected, acting as a corrective phase to consolidate prior market gains before the trend resumes upward.
The key invalidation level of 0.61320 serves as a pivotal point in confirming the current bullish outlook. A price move below this level would necessitate a re-evaluation of the Elliott Wave count and trading strategy adjustments.
Summary
- The 4-hour AUDUSD analysis presents a bullish market outlook, with orange wave 1 progressing within navy blue wave 1.
- The projected formation of orange wave 2 provides an opportunity to assess corrective patterns before further bullish continuation.
- The 0.61320 invalidation level is essential for ensuring alignment with the current Elliott Wave count and risk management strategies.
- This analysis offers traders actionable insights into market trends, aiding in informed decision-making based on Elliott Wave principles and bullish momentum confirmation.
Technical Analyst: Malik Awais
Source: visit Tradinglounge.com and learn From the Experts Join TradingLounge Here
Previous: NZDUSD Elliott Wave Technical Analysis
VALUE Offer - Buy 1 Month & Get 3 Months!Click here
Access 7 Analysts Over 200 Markets Covered. Chat Room With Support
