07Feb

Berkshire Hathaway Inc. (BRK.B) Elliott Wave Analysis: Navigating Market Trends and Trading Opportunities - February 7, 2024

BRK.B Elliott Wave Analysis Daily Chart, 7 February 24

Trading Lounge Berkshire Hathaway Inc., (BRK.B) Elliott Wave Technical Analysis offers invaluable insights into market trends and trading opportunities. Today, we delve into the daily and 4-hour charts to discern the unfolding patterns and identify potential trading scenarios.

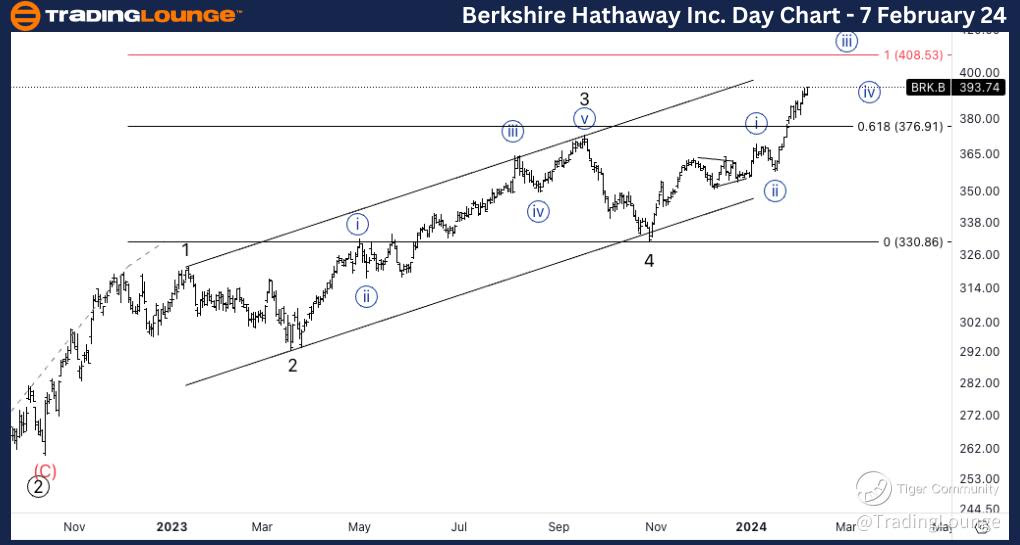
Daily Chart Analysis:

  • Trend Functionality: The Elliott Wave analysis on BRK.B's daily chart reveals a prominent trend, characterized by a motive structure.
  • Impulse Mode: The prevailing mode suggests an impulse pattern, indicating sustained directional movements.
  • Motive Structure: The current structure highlights Minor wave 5 of (1), showcasing a motive phase in the market cycle.
  • Positioning: BRK.B appears to be in the midst of Minor wave 5, with indications pointing towards a top formation in wave 5.
  • Directional Insight: As we witness the progression of Minor wave 5, particularly in wave {iii} of 5, attention is drawn to the $400 resistance level as a potential barrier.

BRK-B-day-stock-char...


BRK.B Elliott Wave Analysis Trading Lounge 4Hr Chart Analysis, 7 February 24

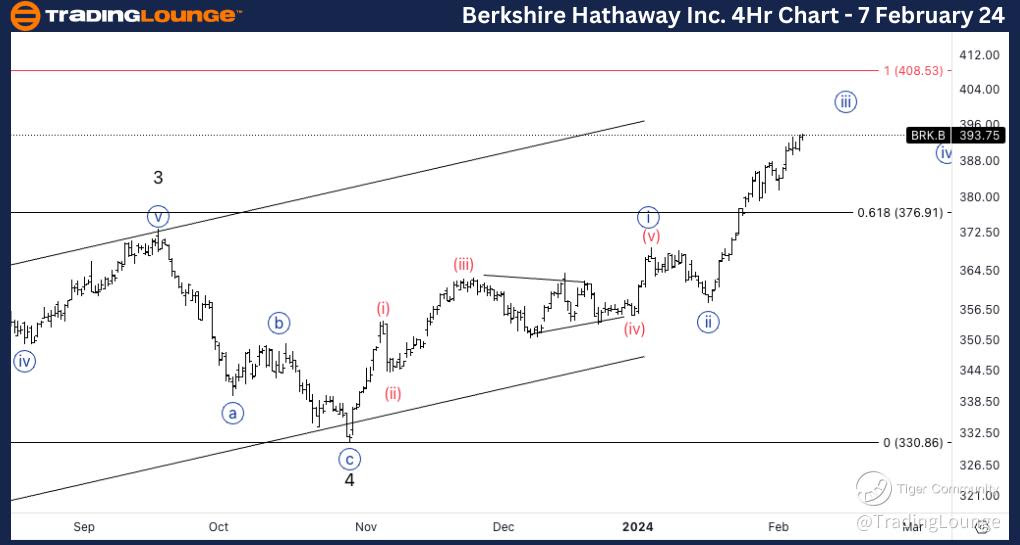
Berkshire Hathaway Inc., (BRK.B) 4H Chart:

  • Trend Functionality: Transitioning to the 4-hour chart, the Elliott Wave analysis continues to unveil valuable insights into BRK.B's market dynamics.

  • Impulsive Mode: The mode remains impulsive, suggesting dynamic price movements conducive to trading opportunities.

  • Motive Structure: Similar to the daily chart, the 4-hour chart emphasizes a motive structure, highlighting wave {iii} of 5.
  • Positioning: Wave {iii} of 5 takes precedence on the 4-hour chart, indicating an advanced stage within the broader wave structure.
  • Directional Insight: Notably, the extension into wave (iii) of {iii} signifies a robust upward momentum, particularly evident in the minor correction around $380, suggesting a lower degree correction.

In conclusion, the Elliott Wave analysis on BRK.B's daily and 4-hour charts presents a comprehensive outlook on market trends and trading opportunities. By understanding the intricate patterns and structural formations, traders can navigate the markets with confidence and precision.

Technical Analyst: Alessio Barretta

Source: visit Tradinglounge.com and learn From the Experts Join TradingLounge Here 

See Previous: Netflix Inc., (NFLX)

BRK-B-4h-stock-chart...

Welcome to our BRK.B Elliott Wave Analysis Trading Lounge, your go-to source for comprehensive insights into Berkshire Hathaway Inc. (BRK.B) through Elliott Wave Technical Analysis. As of the Daily Chart on 7th February 2024, we delve into pivotal trends shaping the market.

*BRK.B Elliott Wave Technical Analysis – Daily Chart*

In terms of wave dynamics, we discern a dominant impulse function with a motive structure. The current position is in Minor wave 5 of (1), indicating a potential top in wave 5. Our attention is fixated on the unfolding of Minor wave 5, manifested in a five-wave sequence, particularly as we appear to be in wave {iii} of 5. We anticipate resistance around the $400 mark.

*BRK.B Elliott Wave Technical Analysis – 4Hr Chart*

Here, the wave function remains impulsive with a motive structure. The present position is in Wave {iii} of 5, suggesting an extension into wave (iii) of {iii}. Notably, the pullback around $380 appears smaller than what is labeled as wave {ii}, indicating a lower degree correction. This suggests a potential wave (iii) of {iii} scenario.

Related

Texas Instruments (TXN) Elliott Wave Analysis: Stock Forecast, Price Prediction, Bullish Trend, and Trading Strategy for Smart Investors

Texas Instruments (TXN) Elliott Wave Analysis: Stock Forecast, Price Prediction, Bullish Trend, and Trading Strategy for Smart Investors

Texas Instruments (TXN) Elliott Wave analysis with insights into its bullish trend, price forecast, ...

Read More >
Exxon Mobil Corp.(XOM:NYSE) Elliott Wave Technical Analysis 24 October 23

Exxon Mobil Corp.(XOM:NYSE) Elliott Wave Technical Analysis 24 October 23

Exxon Mobil Corp.(XOM: NYSE) Elliott Wave Technical Analysis 4-hour chart and 1-hour chart for 24 Oc...

Read More >
Meta Platforms Inc.(META:NASDAQ) Elliott Wave Technical Analysis 30 November 23

Meta Platforms Inc.(META:NASDAQ) Elliott Wave Technical Analysis 30 November 23

Meta Platforms Inc.(META: NASDAQ) Elliott Wave Technical Analysis dated 30 November 23. META Stock M...

Read More >
Johnson & Johnson (JNJ) Elliott Wave Analysis: Understanding the Trend Direction and Potential Price Movements

Johnson & Johnson (JNJ) Elliott Wave Analysis: Understanding the Trend Direction and Potential Price Movements

Explore the Elliott Wave analysis for Johnson & Johnson (JNJ) focusing on trend direction and price ...

Read More >
NEOUSD Elliott Wave Analysis: Bullish Setup for Wave (3) | NEO Price Prediction and Swing Trade Strategies for Crypto Traders

NEOUSD Elliott Wave Analysis: Bullish Setup for Wave (3) | NEO Price Prediction and Swing Trade Strategies for Crypto Traders

NEOUSD is stabilising after a major decline, setting up a bullish Elliott Wave (3) rally. Learn key ...

Read More >
Wheat Elliott Wave Technical Analysis: Latest Price Forecast, Market Trends, and Trading Strategy for 2025 Commodity Futures

Wheat Elliott Wave Technical Analysis: Latest Price Forecast, Market Trends, and Trading Strategy for 2025 Commodity Futures

Wheat is nearing the completion of a long-term bearish impulse wave, with a potential multi-week or ...

Read More >

$1 for 2 Weeks

then $29 a month!

What a Special Offer!

Trade Recommendations

Unleash the power of deversified trading with our comprehensive portfolio, covering 250+ markets:

  • Stock Trades
  • Crypto Trades
  • Forex Trades
  • Commodity Trades
Elliott Wave Analysis

Gain a competitive edge with expert insights and AI-powered Elliott Wave charting into:

  • Global Indices
  • US Stocks & ASX Stocks
  • Forex & Crypto
  • Commodities
Top-Notch Trading Tools

Equip yourself with the tools of success:

  • Real-time Chat rooms
  • Elliott Wave Algorithm
  • Portfolio tools
  • TradingLevels
  • Screener
  • Trading Game
7 Elliott Wave Analysts

Stay ahead of the market with daily charts and insightful videos
Your secret to strategic trading!

JOIN HERE


Welcome to TradingLounge (ASIC A.R.No. 321187), specialists in trades, trading education and technical analysis, covering stocks, indices, commodities, forex and cryptocurrencies.

When you join TradingLounge you have access to everything we offer, including trade tools, educational content and a social platform to chat with like-minded investors.

Read more

@Copyright 2024 by tradinglounge.com

Contact Us

Australian no: 02 4787 6020

International no: +61 (2) 47876020

Pay with:

Find us on