06Feb

NFLX Elliott Wave Analysis: Minor Wave 1 Top Confirmed, Bears Gaining Momentum 6 February 24

NFLX Elliott Wave Analysis Trading Lounge Daily Chart, 6 February 24

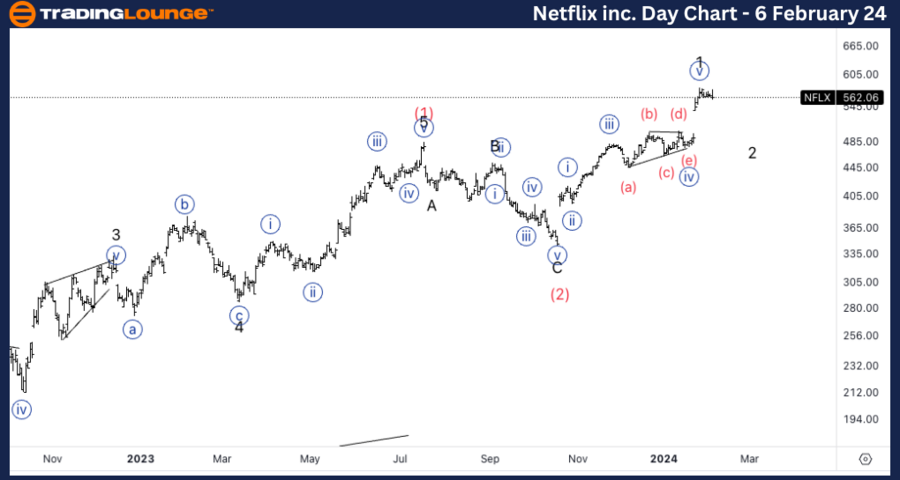
Netflix Inc., (NFLX) Daily Chart

NFLX Elliott Wave Technical Analysis

FUNCTION: Trend

MODE: Impulse

STRUCTURE: Motive

POSITION: Minor wave 1 of (3).

DIRECTION: Top in wave 1.  

DETAILS: Considering the possibility of a top in Minor wave 1 as we can identify a clear five wave move. There is a possibility we are already in Minor wave 3 and wave 1 top stands where current wave (b) of {iv} is.

Technical Analyst: Alessio Barretta

Source: visit Tradinglounge.com and learn From the Experts Join TradingLounge Here 

See Previous: Exxon Mobil Corp.

Netflix-In-Day-stock...


NFLX Elliott Wave Analysis Trading Lounge 4Hr Chart, 6 February 24

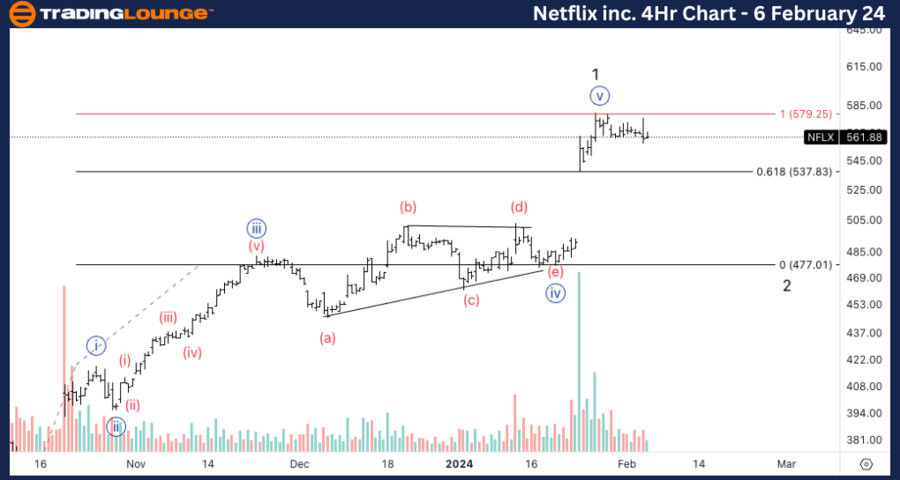
Netflix Inc., (NFLX) 4Hr Chart

NFLX Elliott Wave Technical Analysis

FUNCTION: Counter Trend

MODE: Corrective

STRUCTURE: Zigzag  

POSITION: Wave {a} of 2.

DIRECTION: Acceleration lower into wave {a}.

DETAILS: As volume is starting to slowly increase during the last session, it appears that the move down is starting to be support by volume, suggesting bears are stepping into the market. In addition awe have reached wave {v} common target of equality with its wave {i}.

Netflix-In-4hr-stock...

Welcome to our NFLX Elliott Wave Analysis Trading Lounge, your hub for insightful analysis of Netflix Inc. (NFLX) through Elliott Wave Technical Analysis. As of the Daily Chart on 6th February 24, we dissect significant trends in the market.

*NFLX Elliott Wave Technical Analysis – Daily Chart*

In terms of wave dynamics, we identify a dominant impulse function with a motive structure. The current position is in Minor wave 1 of (3), indicating a potential top in wave 1. We closely monitor the possibility of a top in Minor wave 1, particularly as we discern a clear five-wave move. There's also a consideration that we might already be in Minor wave 3, with the wave 1 top potentially coinciding with the current wave (b) of {iv}.

*NFLX Elliott Wave Technical Analysis – Daily Chart*

Here, the wave function adopts a counter trend approach with a corrective mode, reflecting a zigzag structure. The present position is in Wave {a} of 2, indicating an acceleration lower into wave {a}. Notably, there's a gradual increase in volume during the recent sessions, suggesting bearish momentum entering the market. Additionally, we've reached the common target of equality between wave {v} and its wave {i}.

Related

U.S. Dollar / Swiss Franc Forex Currency Pair and  USDCHF Elliott Wave Technical Analysis Focusing on Daily and 4-hour Charts

U.S. Dollar / Swiss Franc Forex Currency Pair and USDCHF Elliott Wave Technical Analysis Focusing on Daily and 4-hour Charts

This article provides a comprehensive USDCHF Elliott Wave analysis, focusing on daily and 4-hour cha...

Read More >
Unlocking ASX Trading Success: BLOCK INC. - SQ2 Stock Analysis & Elliott Wave Technical Forecast

Unlocking ASX Trading Success: BLOCK INC. - SQ2 Stock Analysis & Elliott Wave Technical Forecast

Our comprehensive analysis provides an insightful look into Block Inc. - SQ2 using Elliott Wave theo...

Read More >
ASX: Mineral Resources Limited (MIN) - Elliott Wave Analysis & Stock Forecast With Possible Upward Trends

ASX: Mineral Resources Limited (MIN) - Elliott Wave Analysis & Stock Forecast With Possible Upward Trends

This article provides an Elliott Wave analysis for ASX: Mineral Resources Limited (MIN), highlightin...

Read More >
Elliott Wave Analysis Forecast: Bitcoin, Gold, Silver, and Crude Oil Trends

Elliott Wave Analysis Forecast: Bitcoin, Gold, Silver, and Crude Oil Trends

This analysis provides a comprehensive overview of the current trends in the commodity market throug...

Read More >
XRPUSD Elliott Wave Analysis Shows Key Fibonacci Support with Bullish Breakout Potential for Crypto Traders and Swing Trading Strategy

XRPUSD Elliott Wave Analysis Shows Key Fibonacci Support with Bullish Breakout Potential for Crypto Traders and Swing Trading Strategy

This article offers an in-depth XRPUSD Elliott Wave analysis featuring key support/resistance levels...

Read More >

$1 for 2 Weeks

then $29 a month!

What a Special Offer!

Trade Recommendations

Unleash the power of deversified trading with our comprehensive portfolio, covering 250+ markets:

  • Stock Trades
  • Crypto Trades
  • Forex Trades
  • Commodity Trades
Elliott Wave Analysis

Gain a competitive edge with expert insights and AI-powered Elliott Wave charting into:

  • Global Indices
  • US Stocks & ASX Stocks
  • Forex & Crypto
  • Commodities
Top-Notch Trading Tools

Equip yourself with the tools of success:

  • Real-time Chat rooms
  • Elliott Wave Algorithm
  • Portfolio tools
  • TradingLevels
  • Screener
  • Trading Game
7 Elliott Wave Analysts

Stay ahead of the market with daily charts and insightful videos
Your secret to strategic trading!

JOIN HERE


Welcome to TradingLounge (ASIC A.R.No. 321187), specialists in trades, trading education and technical analysis, covering stocks, indices, commodities, forex and cryptocurrencies.

When you join TradingLounge you have access to everything we offer, including trade tools, educational content and a social platform to chat with like-minded investors.

Read more

@Copyright 2024 by tradinglounge.com

Contact Us

Australian no: 02 4787 6020

International no: +61 (2) 47876020

Pay with:

Find us on