Trading Opportunities with Elliott Wave Analysis of BLOCK INC. - SQ2 on the ASX

Greetings, Our Elliott Wave analysis today updates the Australian Stock Exchange (ASX) with BLOCK INC. - SQ2. We've identified a countertrend move (ABC) with Wave 2-red unfolding, which also presents a good trading opportunity with Wave 3-red to follow once Wave 2-red completes. Therefore, we'll closely monitor Block Inc. - SQ2 in the coming days.

ASX: BLOCK INC. - SQ2 Elliott Wave Technical Analysis  

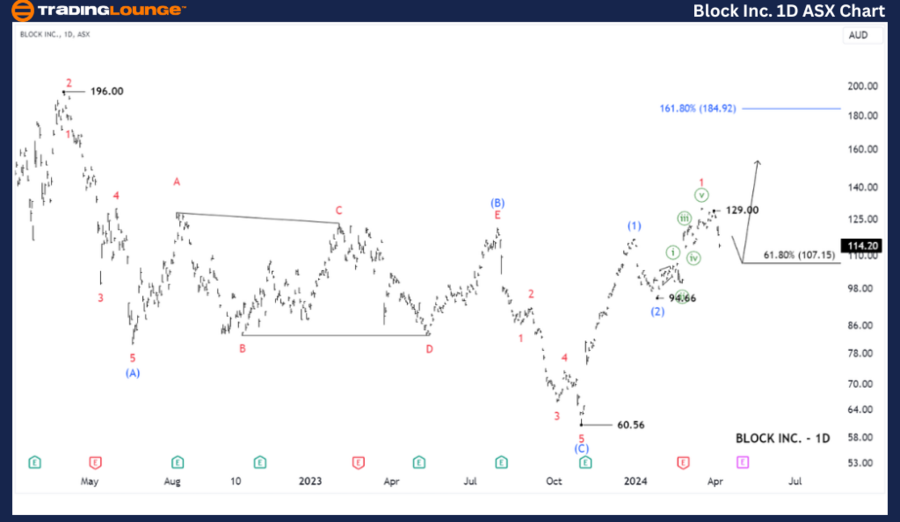
ASX: BLOCK INC. - SQ2 1D Chart (Semilog Scale) Analysis

Function: Major trend (Intermediate degree, blue)

Mode: Motive

Structure: Impulse

Position: Wave 3-red of Wave (3)-blue

Details: The short-term outlook suggests that since the low at 60.56, waves (1), (2), (3)-blue have unfolded to push higher. Wave (2)-blue appears to have just completed at 94.66, and wave (3)-blue is now unfolding to push higher, targeting 184.92. Currently, at a smaller degree, wave 1-red has peaked, and wave 2-red is unfolding to push slightly lower until it completes, after which wave 3-red will resume and rise even higher. A push above 129.00 would renew the bullish outlook.

Invalidation point: 94.66

BLOCK-INC-1D-ASX-cha...


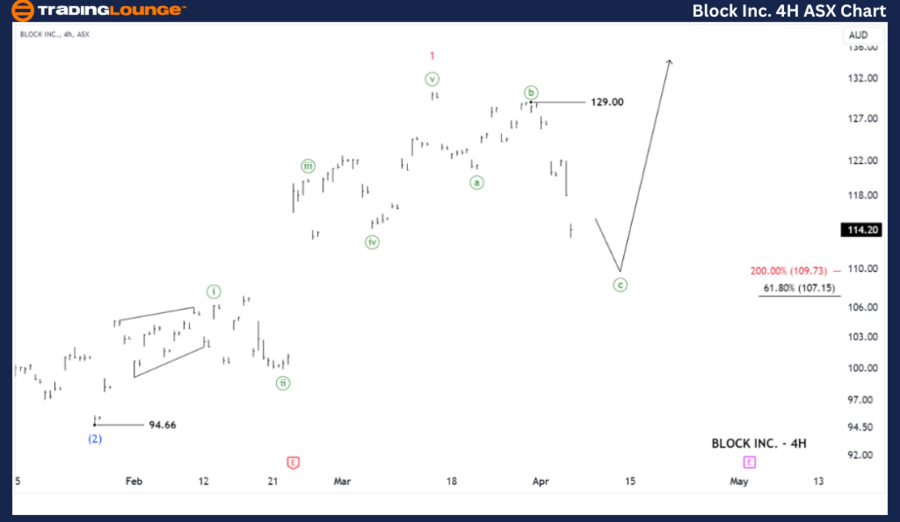
ASX: BLOCK INC. - SQ2 Elliott Wave Analysis 4-Hour Chart

ASX: BLOCK INC. – SQ2 Elliott Wave Technical Analysis

ASX: BLOCK INC. – SQ2 4-Hour Chart Analysis

Function: Major trend (Minor degree, red)

Mode: Motive

Structure: Impulse

Position: Wave ((c))-green of Wave 2-red

Details: The short-term outlook suggests that wave 1-red has recently peaked, and wave 2-red is unfolding to push lower, possibly targeting the range of 109.73 - 107.15. Therefore, this is an opportunity to observe and wait until the corrective wave 2-red concludes, which will open up a good trading opportunity with wave 3-red to push even higher.

Invalidation point: 94.66

Conclusion:  

Our analysis, forecast of contextual trends, and short-term outlook for ASX: BLOCK INC. - SQ2 aim to provide readers with insights into the current market trends and how to capitalize on them effectively. We offer specific price points that act as validation or invalidation signals for our wave count, enhancing confidence in our perspective. By combining these factors, we strive to offer readers the most objective and professional perspective on market trends.

Technical Analyst: Hua (Shane) Cuong, CEWA-M (Master’s Designation).

Source: visit Tradinglounge.com and learn From the Experts Join TradingLounge Here 

Previous: ASX: RAMSAY HEALTH CARE LIMITED (RHC)

TradingLounge Once Off SPECIAL DEAL: Here > 1 month Get 3 months.

TradingLounge's Free Week Extravaganza!

April 14 – 21: Unlock the Doors to Trading Excellence — Absolutely FREE

BLOCK-INC-4hr-ASX-ch...

Related

Understanding Alphabet Inc. (GOOGL) Through Elliott Wave Analysis: An In-depth Daily and 4-Hour Chart Review

Understanding Alphabet Inc. (GOOGL) Through Elliott Wave Analysis: An In-depth Daily and 4-Hour Chart Review

Dive into an in-depth analysis of Alphabet Inc. (GOOGL) with our latest stock forecast and Elliott W...

Read More >
Comprehensive XRP Price Prediction: Elliott Wave Analysis and Proven Trading Strategies for XRPUSD

Comprehensive XRP Price Prediction: Elliott Wave Analysis and Proven Trading Strategies for XRPUSD

This article provides a detailed XRP price prediction through Elliott Wave analysis, focusing on XRP...

Read More >
Unlocking Market Potential: SP500 at 5000 and Nasdaq 100 at 18000 Resistances - Elliott Wave Analysis Update

Unlocking Market Potential: SP500 at 5000 and Nasdaq 100 at 18000 Resistances - Elliott Wave Analysis Update

SP500 at 5000, Nasdaq 100 near 18000 resistance. Markets may temporarily breach, but gravitational p...

Read More >
Stay updated with the latest price forecasts with Natural Gas Commodity Elliott Wave Technical Analysis

Stay updated with the latest price forecasts with Natural Gas Commodity Elliott Wave Technical Analysis

Explore our comprehensive analysis of natural gas prices using Elliott Wave theory. Understand marke...

Read More >
MicroStrategy Inc. ( MSTR) Stocks Elliott Wave Technical Analysis: Detailed Examination of MSTR's Price Movements

MicroStrategy Inc. ( MSTR) Stocks Elliott Wave Technical Analysis: Detailed Examination of MSTR's Price Movements

Our latest Elliott Wave analysis for MicroStrategy Inc. (MSTR), offers a detailed examination of MST...

Read More >
U.S. Dollar / Swiss Franc Forex Technical Analysis | USDCHF Elliott Wave Analysis: Day and 4-Hour Chart Forecast for Traders

U.S. Dollar / Swiss Franc Forex Technical Analysis | USDCHF Elliott Wave Analysis: Day and 4-Hour Chart Forecast for Traders

This post provides a comprehensive USDCHF Elliott Wave analysis, including insights from day and 4-h...

Read More >

Buy 1 Month

Get 3 Months!

Special Offer:

Trade Recommendations

Unleash the power of deversified trading with our comprehensive portfolio, covering:

  • Stock Trades
  • Crypto Trades
  • Forex Trades
  • Commodity Trades
Elliott Wave Analysis

Gain a competive edge with expert insights in to:

  • Global Indices
  • US Stocks & ASX Stocks
  • Forex & Crypto
  • Commodities
Top-Notch Trading Tools

Equip yourself with the tools of success:

  • Social Chat
  • Elliott Wave Algorithm
  • Screener
  • TradingLevels
  • Trading Game
7 Elliott Wave Analysts

Stay ahead of the market with daily charts and insightful videos
-Your secret to strategic trading!

JOIN HERE


Welcome to TradingLounge (ASIC A.R.No. 321187), specialists in trades, trading education and technical analysis, covering stocks, indices, commodities, forex and cryptocurrencies.

When you join TradingLounge you have access to everything we offer, including trade tools, educational content and a social platform to chat with like-minded investors.

Read more

@Copyright 2024 by tradinglounge.com

Contact Us

Australian no: 02 4787 6020

International no: +61 (2) 47876020

Pay with:

Find us on