CSX Corp. (CSX) Elliott Wave Analysis – Daily & 1H Chart
This Elliott Wave analysis of CSX Corp. (CSX) provides insights into both the daily and 1-hour chart structures, emphasizing the ongoing market trends and potential price movements.
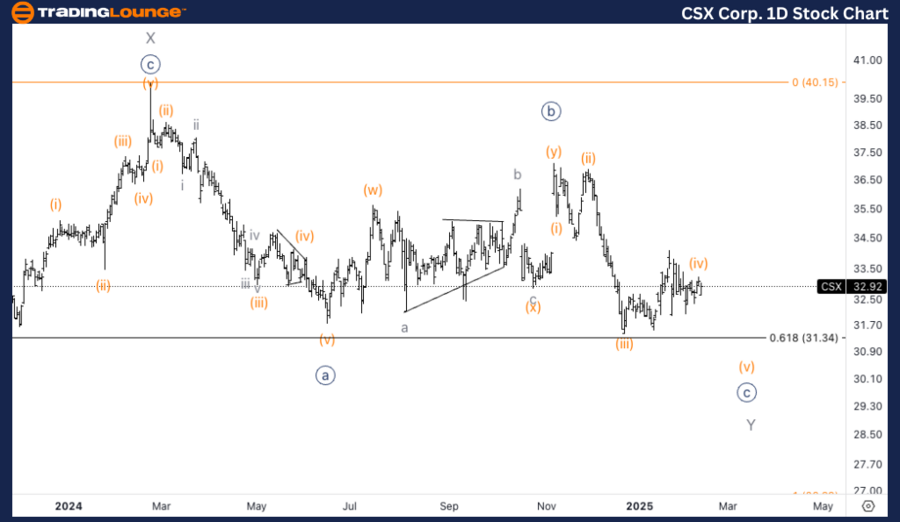
CSX Corp. (CSX) Elliott Wave Analysis - Daily Chart
CSX Elliott Wave Technical Analysis
Function: Counter Trend
Mode: Corrective
Structure: Complex
Position: Wave Y of (4)
Direction: Downside into Wave Y
Market Outlook & Key Levels
CSX Corp. (CSX) is navigating through a complex corrective phase, currently unfolding in wave Y of (4). The ongoing correction is projected to complete soon, with the potential to break below wave {a} and reach the equality level of Y vs. W at $27. This level is considered a crucial support, marking the potential bottom of the current wave structure.
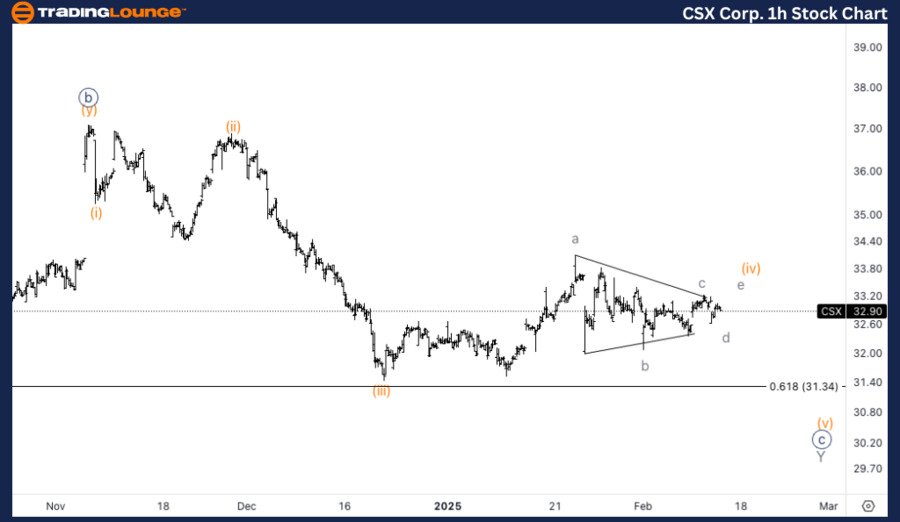
CSX Corp. (CSX) Elliott Wave Analysis - 1-Hour Chart
CSX Elliott Wave Technical Analysis
Function: Counter Trend
Mode: Corrective
Structure: Complex
Position: Wave (iv) of {c}
Direction: Downside into Wave (v)
Market Outlook & Key Levels
On the 1-hour chart, CSX is forming a triangle pattern in wave (iv) of {c}, suggesting a pending downward move. The price is currently consolidating around the MG2 level at $32-33, and once the triangle completes, we anticipate a decline into wave (v). This downward move is expected to mark the final leg of the correction, paving the way for potential trend reversals in the near future.
Technical Analyst: Alessio Barretta
Source: visit Tradinglounge.com and learn From the Experts Join TradingLounge Here
See Previous: MicroStrategy Inc. (MSTR) Elliott Wave Technical Analysis
VALUE Offer - Buy 1 Month & Get 3 Months!Click here
Access 7 Analysts Over 200 Markets Covered. Chat Room With Support