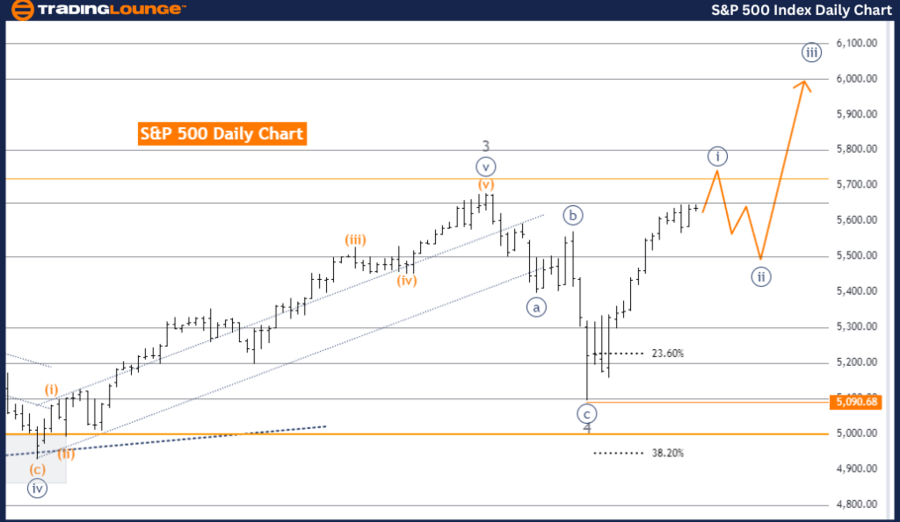
S&P 500 Elliott Wave Analysis Trading Lounge Day Chart
S&P 500 Index Day Chart Analysis
- Function: Bullish Trend
- Mode: Impulsive
- Structure: Navy Blue Wave 1
- Position: Gray Wave 5
- Direction Next Lower Degrees: Navy Blue Wave 2
- Details: Gray Wave 4 appears complete, with Navy Blue Wave 1 of 5 now progressing.
- Wave Cancel Invalid Level: 5,090.68
S&P 500 Index Elliott Wave Technical Analysis
The S&P 500 is displaying a bullish trend, as per the Elliott Wave analysis on the daily chart. The market is currently in an impulsive mode, indicating a strong continuation of the upward trend. The key structure under observation is Navy Blue Wave 1, which is part of a broader bullish pattern.
Currently, the market is within Gray Wave 5, marking the final wave of the impulsive sequence before a potential correction. This suggests that the market is in the later stages of its current upward movement, with the bullish trend remaining active as Navy Blue Wave 1 of 5 unfolds. This continuation follows the completion of Gray Wave 4, indicating that the upward movement has resumed, sustaining the impulsive pattern.
The next lower degree direction points to Navy Blue Wave 2, typically a corrective wave following Wave 1. However, the current focus is on the completion and continuation of Wave 1, implying that the market is still trending upward before any significant correction or pullback.
A crucial level to monitor is 5,090.68, identified as the wave cancel invalid level. Should the market fall below this level, it would invalidate the current wave count, potentially signaling a reversal or change in market direction. This level serves as a key reference point for traders to confirm the ongoing bullish trend.
Summary: The S&P 500 is in a bullish impulsive trend, with Gray Wave 4 completed and Navy Blue Wave 1 of 5 currently progressing. The trend remains upward, but traders should closely watch the 5,090.68 level, as a drop below this point would invalidate the current wave structure and possibly signal a trend reversal.
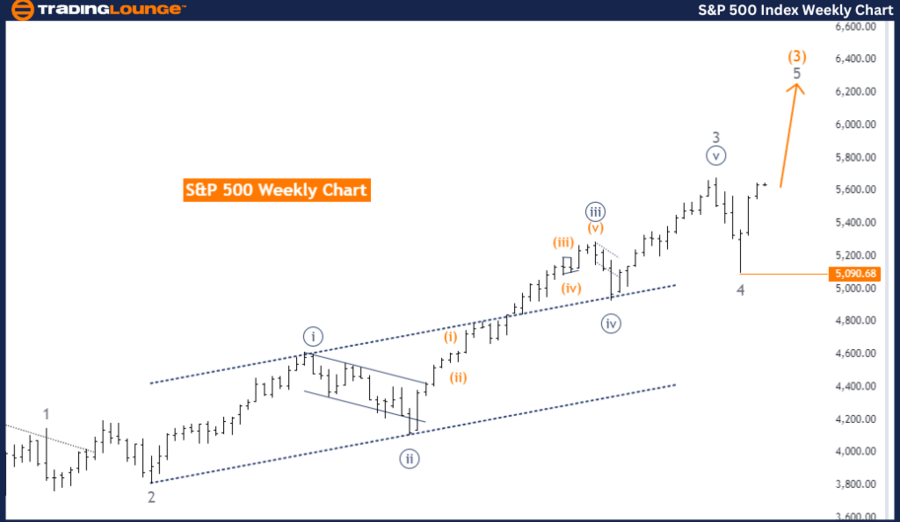
S&P 500 Elliott Wave Analysis Trading Lounge Weekly Chart
S&P 500 Elliott Wave Technical Analysis
- Function: Bullish Trend
- Mode: Impulsive
- Structure: Gray Wave 5
- Position: Orange Wave 3
- Direction Next Lower Degrees: Orange Wave 4
- Details: Gray Wave 4 appears complete, with Gray Wave 5 now progressing.
- Wave Cancel Invalid Level: 5,090.68
The S&P 500 is currently in a bullish trend according to the Elliott Wave analysis on the weekly chart. The market is following an impulsive mode, which indicates strong and continuing upward momentum. The primary structure under analysis is Gray Wave 5, indicating that the market is in the final phase of its current upward impulsive sequence.
At this stage, the market is positioned within Orange Wave 3, which is part of the larger Gray Wave 5 structure. This suggests that the market continues to experience upward movement, with further gains expected before any significant correction. The completion of Gray Wave 4 indicates that any recent correction has concluded, and the market has resumed its upward trajectory with Gray Wave 5 now actively advancing.
The direction for the next lower degrees points to Orange Wave 4, suggesting that after the current upward wave is completed, a corrective phase may follow. However, the immediate focus remains on the continuation of the bullish trend as Gray Wave 5 progresses.
A critical level to monitor is 5,090.68, identified as the wave cancel invalid level. If the market were to fall below this level, it would invalidate the current wave structure, signaling a potential change in market direction or a trend reversal. This level serves as a crucial benchmark for traders to confirm the ongoing bullish trend.
Summary: The S&P 500 is in a bullish impulsive trend on the weekly chart, with the market positioned in Orange Wave 3 of Gray Wave 5. The trend remains upward, but traders should closely watch the 5,090.68 level, as a drop below this point would invalidate the current wave structure and could signal a trend reversal.
Technical Analyst: Malik Awais
Source: visit Tradinglounge.com and learn From the Experts Join TradingLounge Here
Previous: S&P/ASX 200 Index Elliott Wave Technical Analysis
Special Trial Offer - 0.76 Cents a Day for 3 Months! Click here
Access 7 Analysts Over 200 Markets Covered. Chat Room With Support